Monitor Your Infrastructure Security
Where to view security in the Mondoo App using the org overview, space dashboard, security findings, and asset detail views.
The Mondoo App gives you four views of your security, each at a different zoom level:
| View | What it shows | When to use it |
|---|---|---|
| Organization Overview | Trends across every space in the org | Weekly/monthly executive view |
| Space Dashboard | Risk for one space, the top fixes, and remediation progress | Daily team view |
| Security Findings | Every vulnerability, advisory, and misconfiguration in a space or an org | When triaging or searching for a finding |
| Asset Detail | Every check, vulnerability, and advisory for one asset | When fixing or investigating a single asset |
Organization Overview
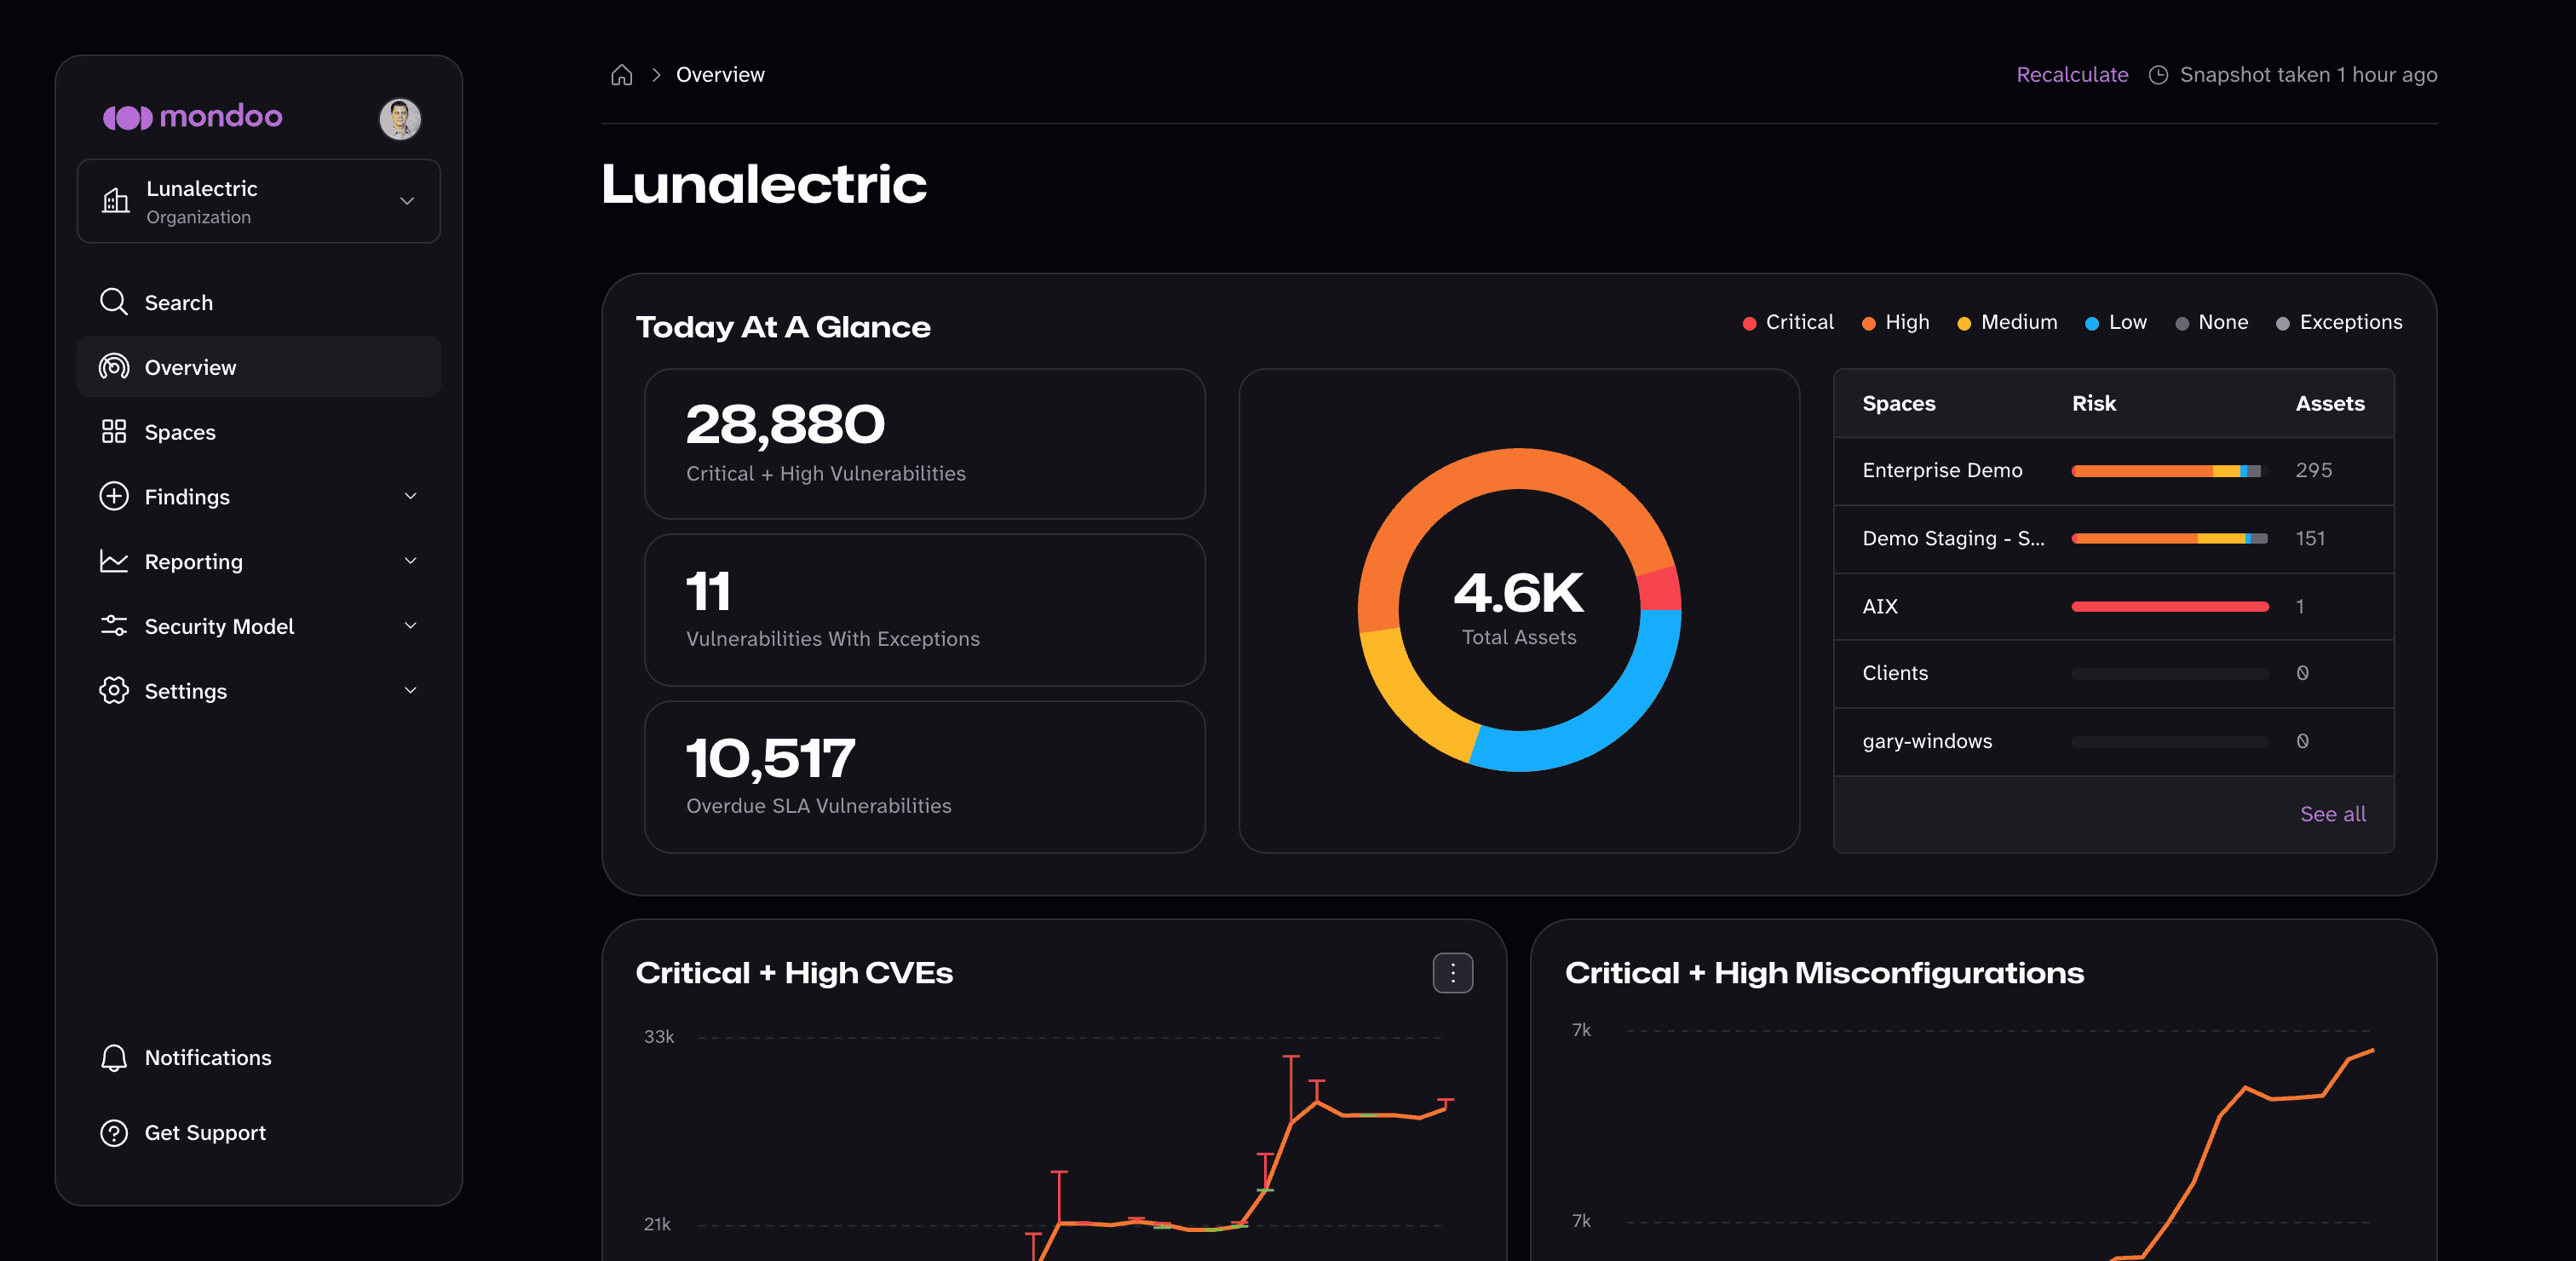
From the Mondoo App, navigate to your organization. The overview shows security trends across every space and surfaces the highest-impact vulnerabilities org-wide:
- Today At A Glance counts critical and high vulnerabilities, vulnerabilities with exceptions, and vulnerabilities past their SLA, breaks down all assets by risk, and lists your spaces with their risk and asset counts.
- Critical + High CVEs and Critical + High Misconfigurations chart how those counts change over time.
- Top Vulnerabilities and Top End of Life list the issues that affect the most assets across the organization.
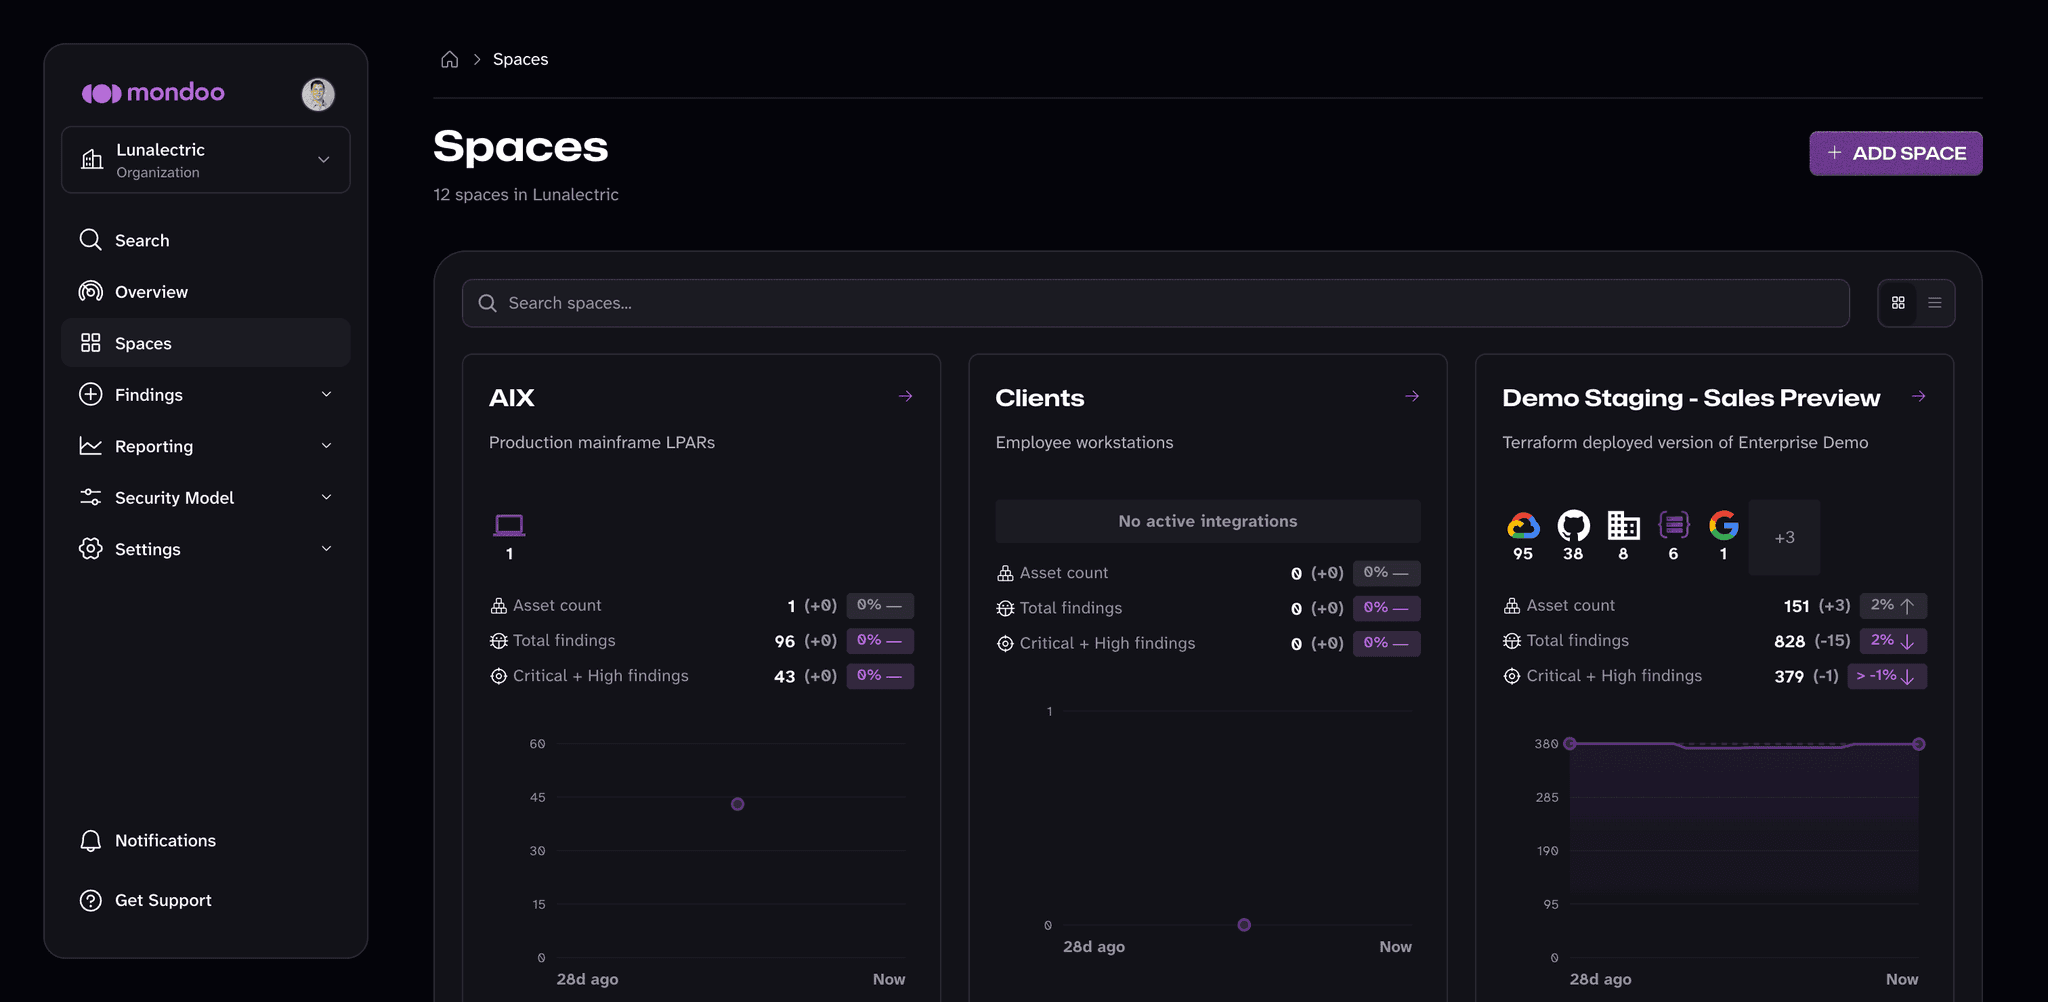
To drill into a space, select Spaces in the side navigation and pick a space.
Space Dashboard
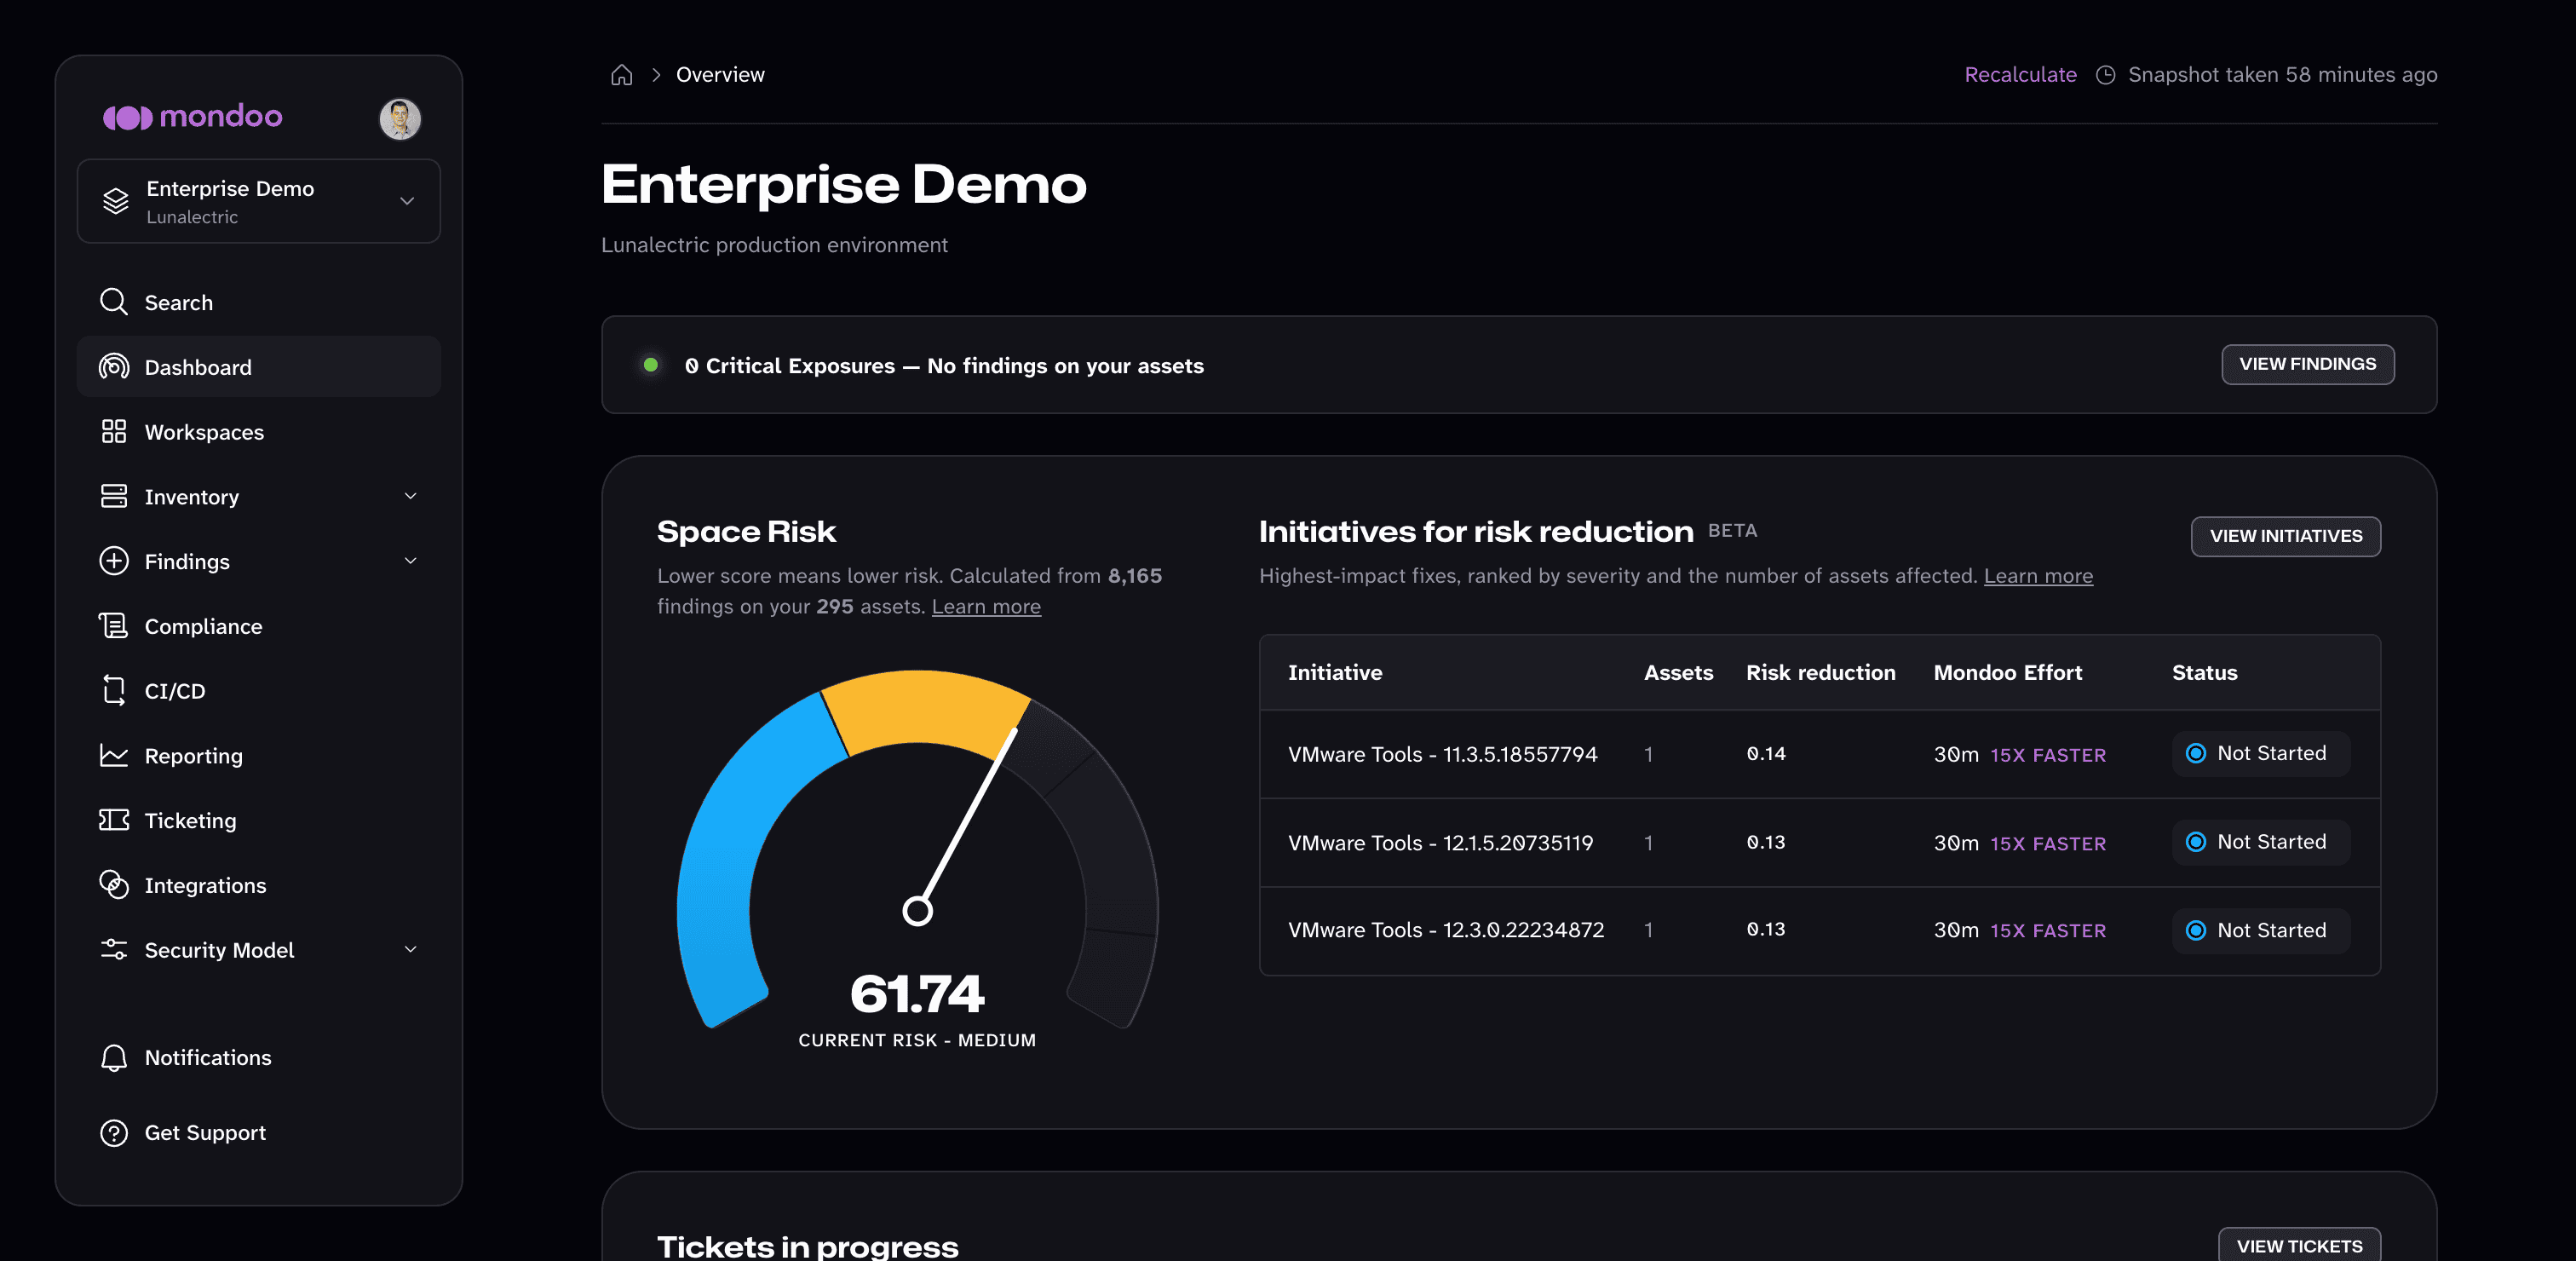
The space dashboard is the daily working view for a security team. To open it, select Dashboard in the side navigation of a space. It opens on the space's current risk and the work that reduces it the most.
The top of the dashboard shows where the space stands right now:
- A Critical Exposures banner counts remotely exploitable findings on internet-exposed assets, the findings to fix first. Select VIEW FINDINGS to see them.
- The Space Risk gauge is a single measure of the space's risk, where a lower score means lower risk. Mondoo shows how many findings and assets the score is calculated from. To learn how it's calculated, read How the Space Risk Score Is Calculated.
- Initiatives for risk reduction (in beta) lists the remediation goals that lower your Space Risk Score the most, with the number of affected assets, the risk reduction, the estimated effort, and the status of each. Select VIEW INITIATIVES to open the full list. To learn more, read Prioritize Risk with Initiatives.
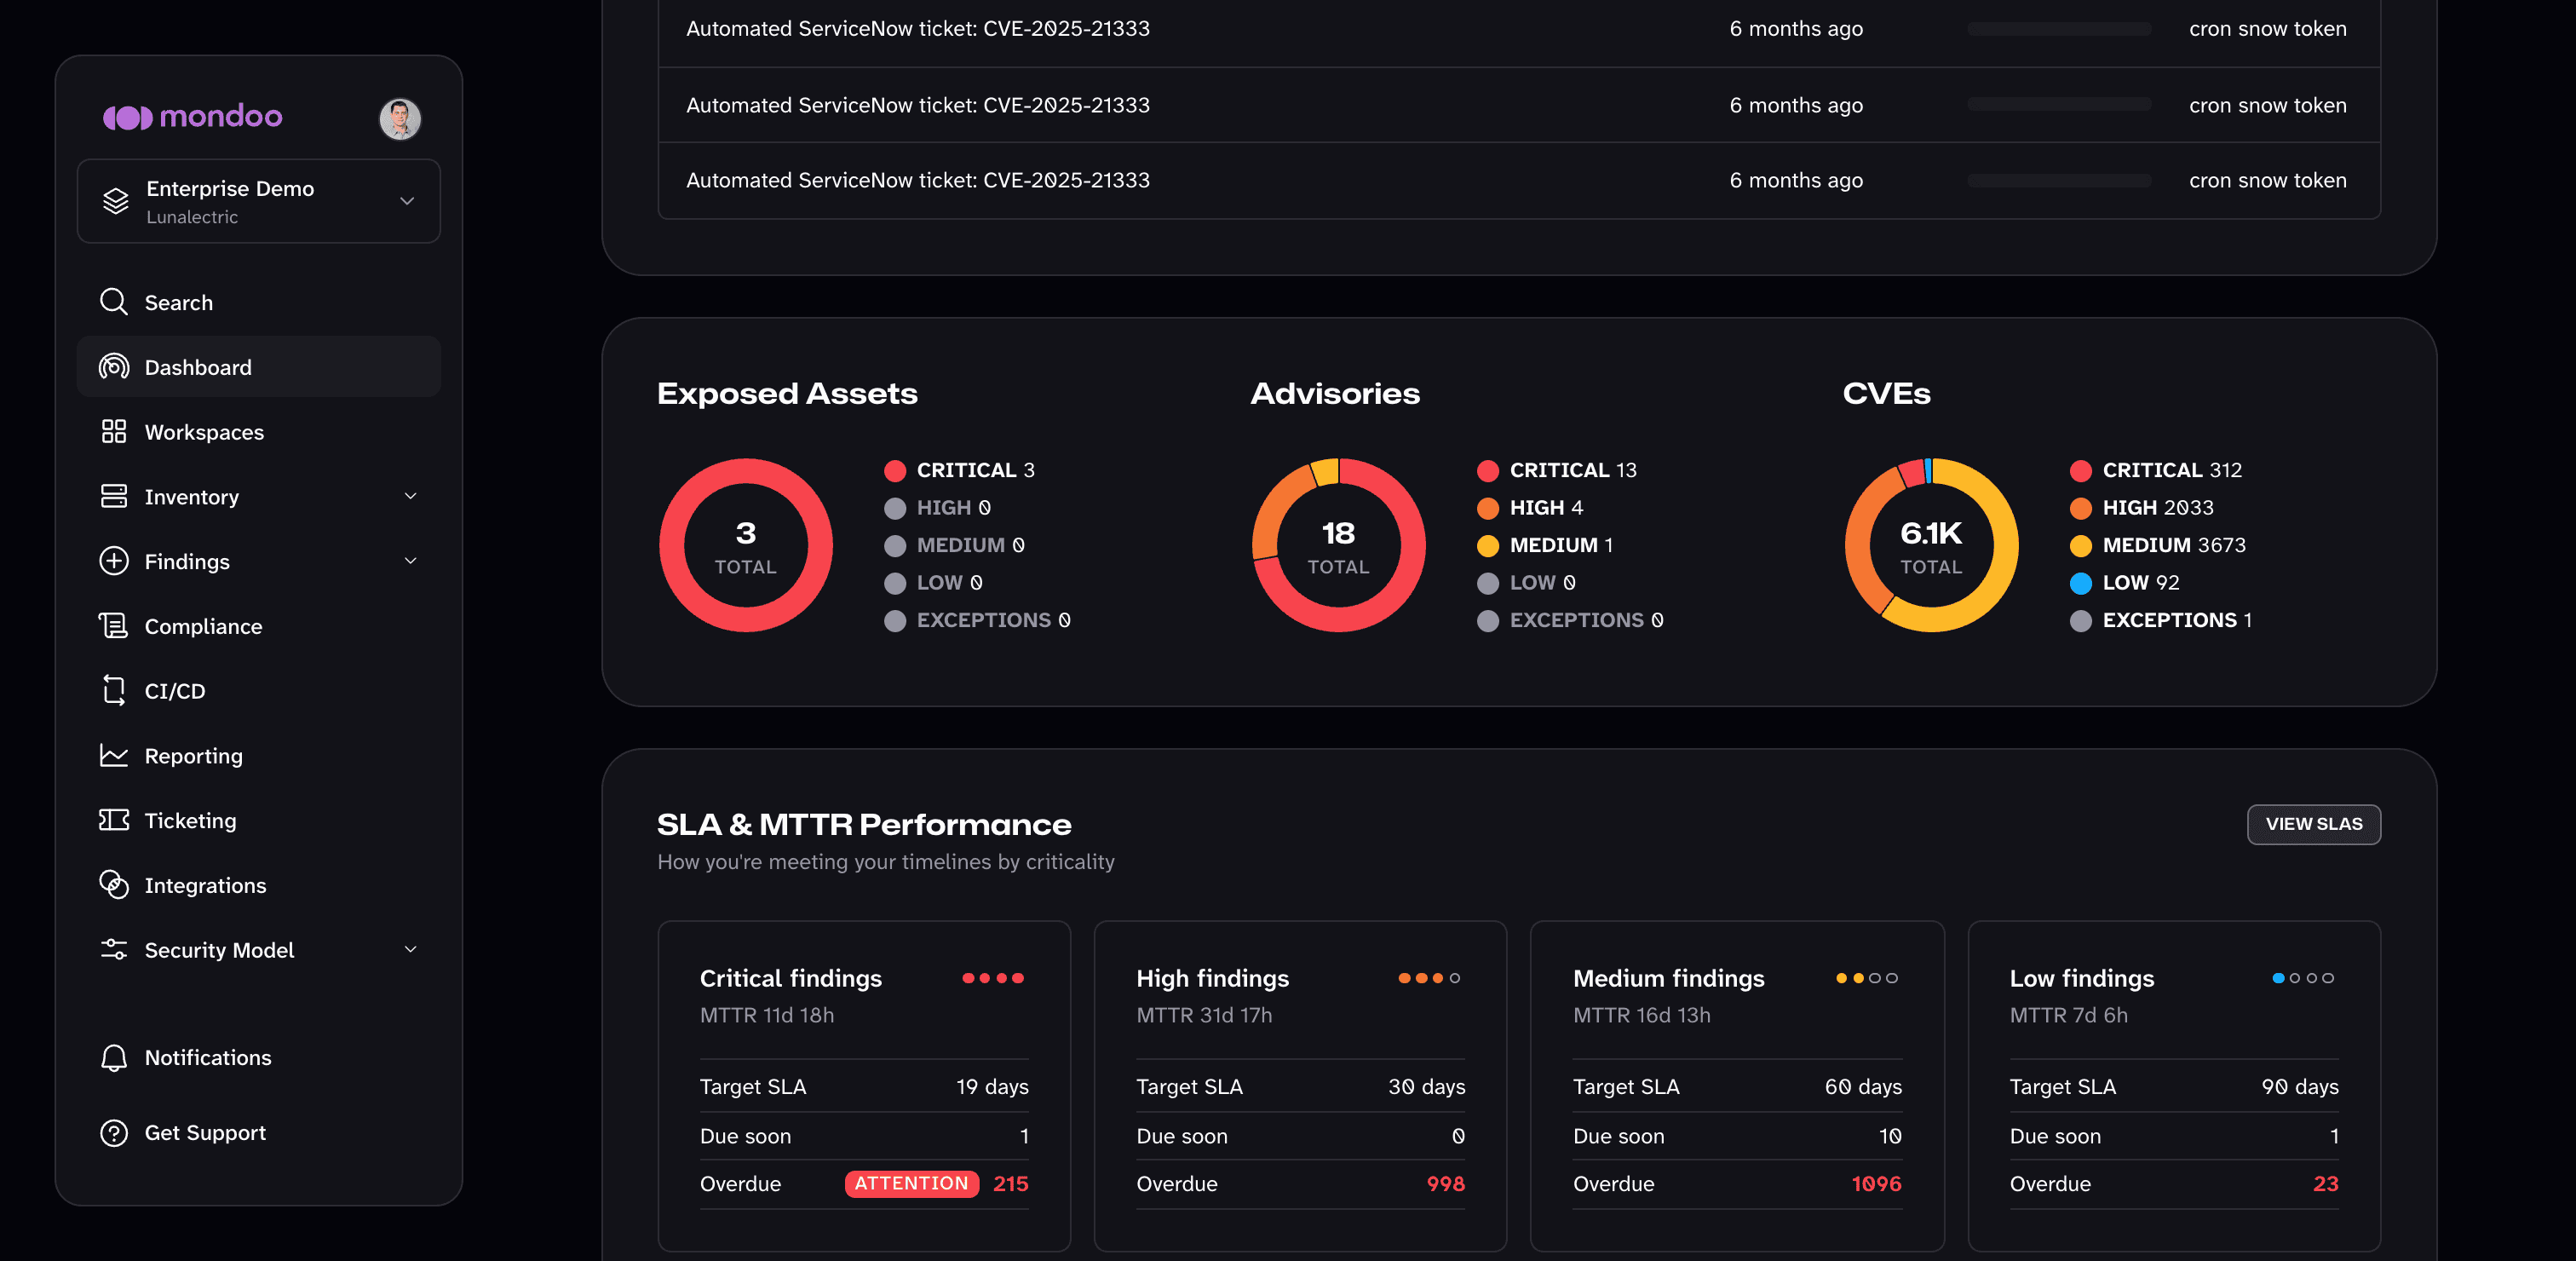
Further down, the dashboard tracks remediation and exposure:
- Tickets in progress lists open tickets that track remediation work, with when and by whom each was created and its progress. Select VIEW TICKETS to open Ticketing.
- Exposed Assets, Advisories, and CVEs break their counts down by severity and show how many have exceptions, so you can see the shape of your outstanding work at a glance. Select a card to open the matching list.
- SLA & MTTR Performance shows, for each severity, your mean time to remediate (MTTR), the target SLA, and how many findings are due soon or overdue. Select VIEW SLAS or a severity card to see the details. To set your targets, read Define Your Team's Service-Level Agreement.
You can also select a workspace to view a subset of assets within a space.
The dashboard is a snapshot. The time of the last snapshot appears in the upper-right corner of the page.
Security Findings
The Security Findings page lists every finding in a space in one table: vulnerabilities (CVEs), vendor advisories, misconfigurations from failed policy checks, and findings imported from other security tools. To open it, select Findings > Security in the side navigation of a space.
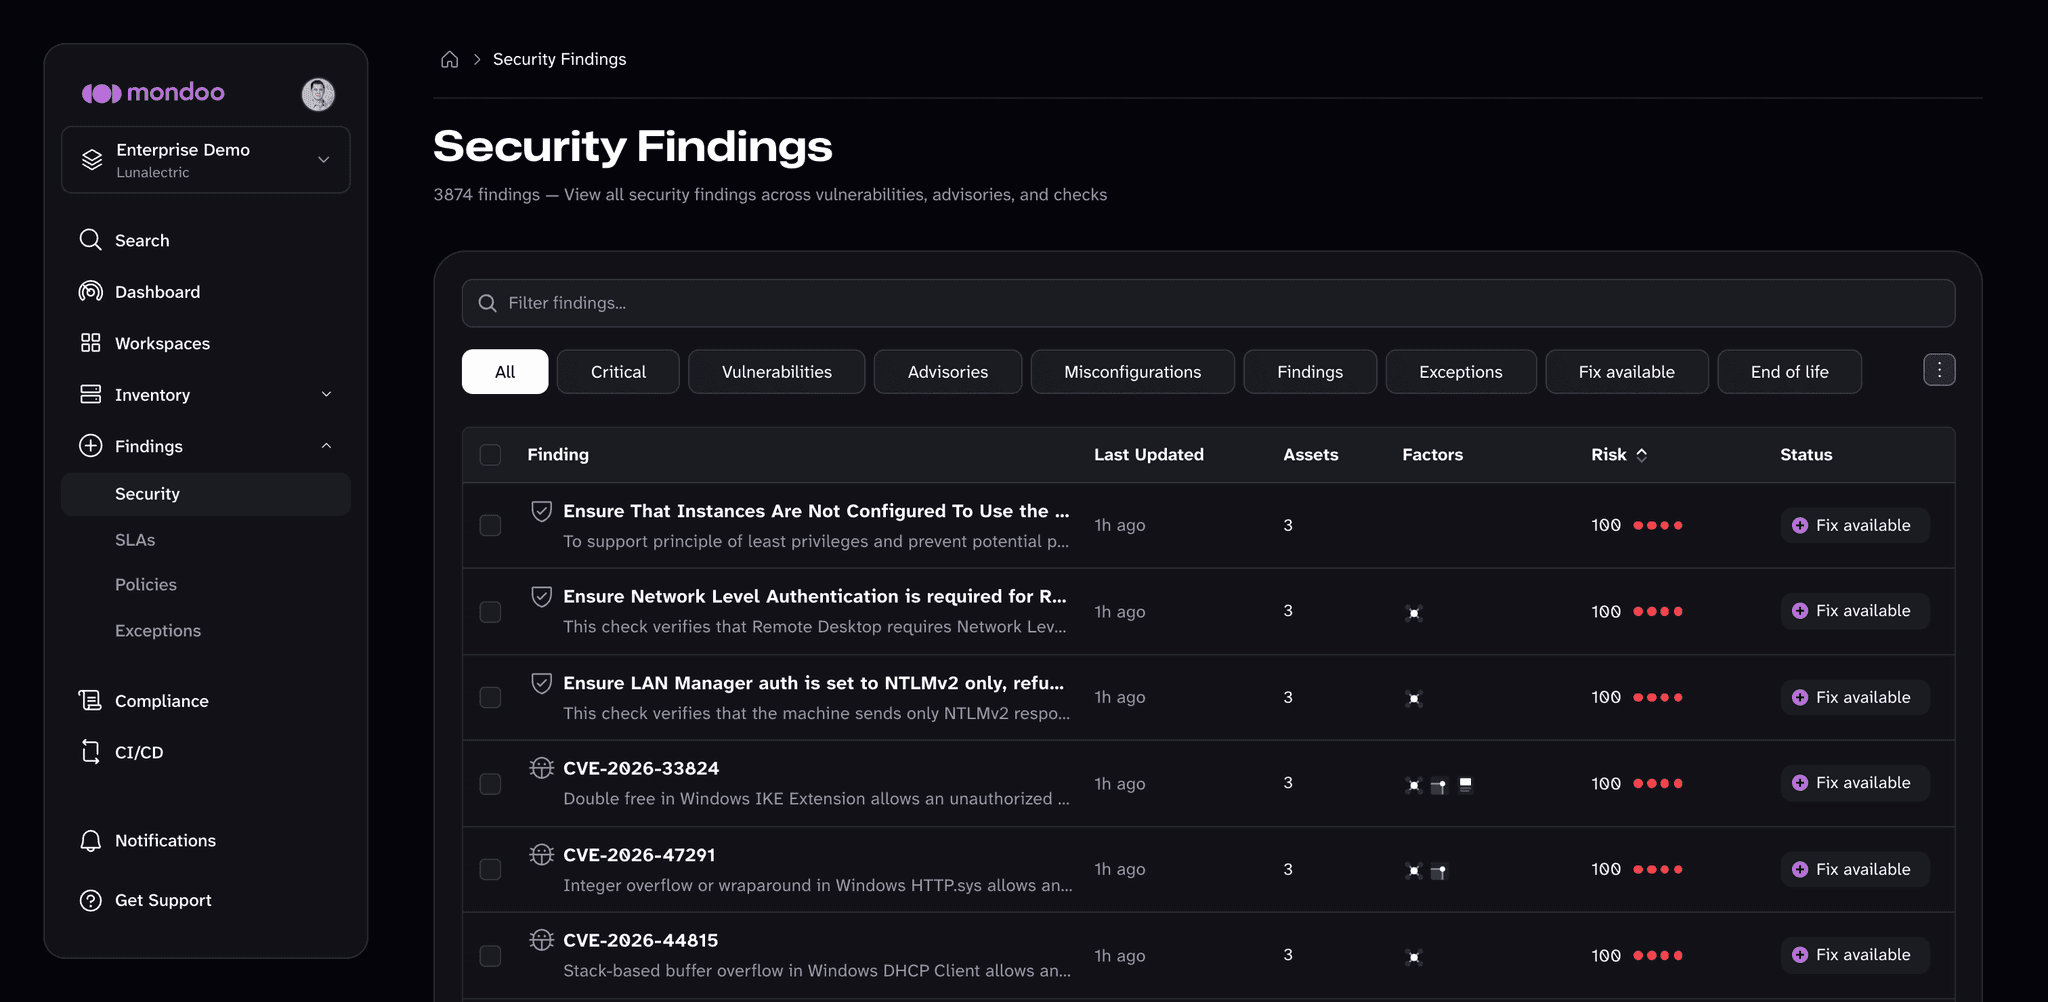
For each finding, the table shows when it was last updated, how many assets it affects, its risk factors, its risk score, and its status. Findings are sorted by risk, highest first.
Narrow the list with the filters above the table:
| Filter | Shows |
|---|---|
| Critical | Findings with a critical risk rating |
| Vulnerabilities | Known vulnerabilities (CVEs). See Find Vulnerabilities. |
| Advisories | Vendor advisories. See Find Vendor Advisories. |
| Misconfigurations | Failed policy checks |
| Findings | Findings from other sources, such as third-party security tools and code, secret, or malware scanners |
| Exceptions | Findings with an exception |
| Fix available | Findings with a known fix |
| End of life | Software and operating systems that have reached end of life |
The type filters (Vulnerabilities, Advisories, Misconfigurations, and Findings) can be combined. To search, type in the search box: for example, a CVE number, a platform name, or a package name.
Select a finding to open its detail page, which describes the finding, shows its risk profile and how it's scored, lists the exposed assets, and includes remediation steps. To act on several findings at once, select their check boxes and choose an action, such as Create Ticket, Set Exception, or Download remediations.
Organization-wide findings
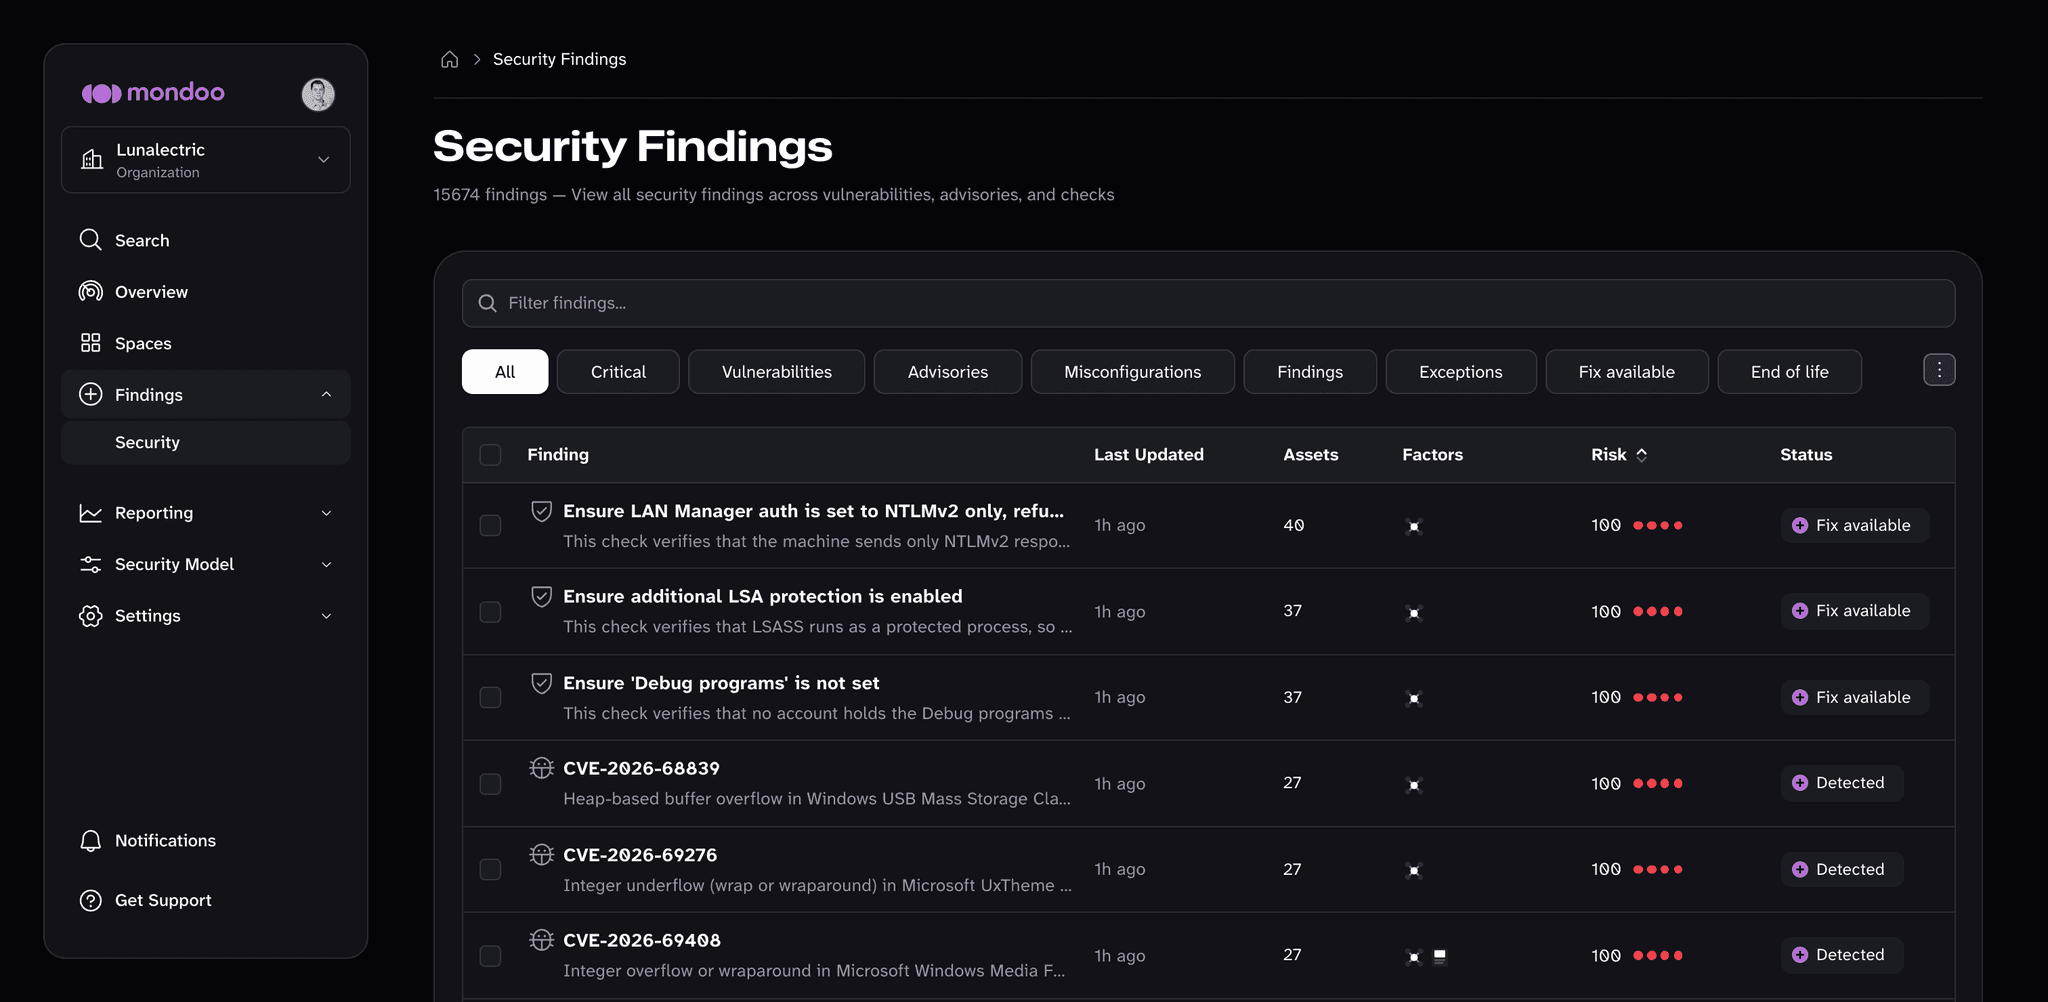
To see findings across every space in your organization, navigate to your organization and select Findings > Security in the side navigation. The organization's Security Findings page has the same table and filters as a space's, and counts each finding across all of the organization's spaces.
Asset Detail
To open a single asset:
-
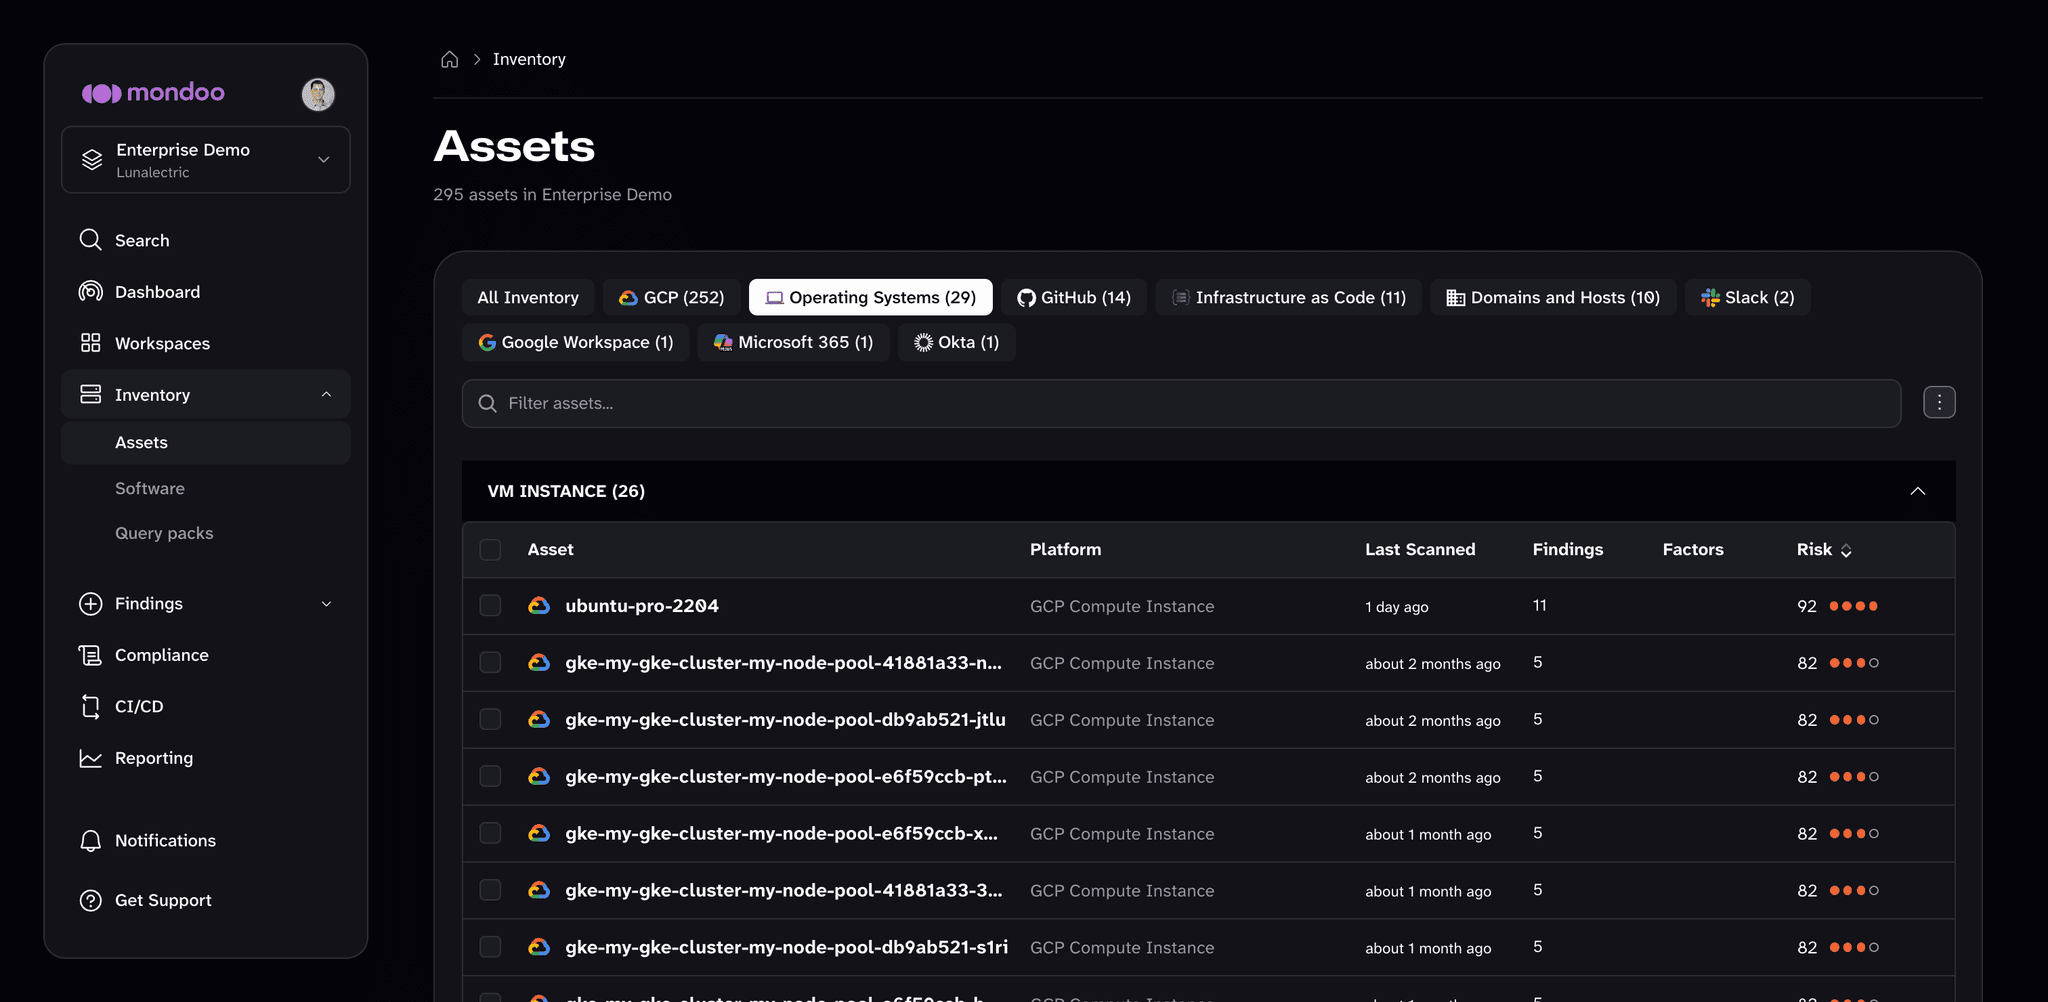
From a space, select Inventory > Assets in the side navigation.
-
Filter the list using the integration type chips (such as GCP or Operating Systems) or the search box.
-
Select the asset to open its detail page.
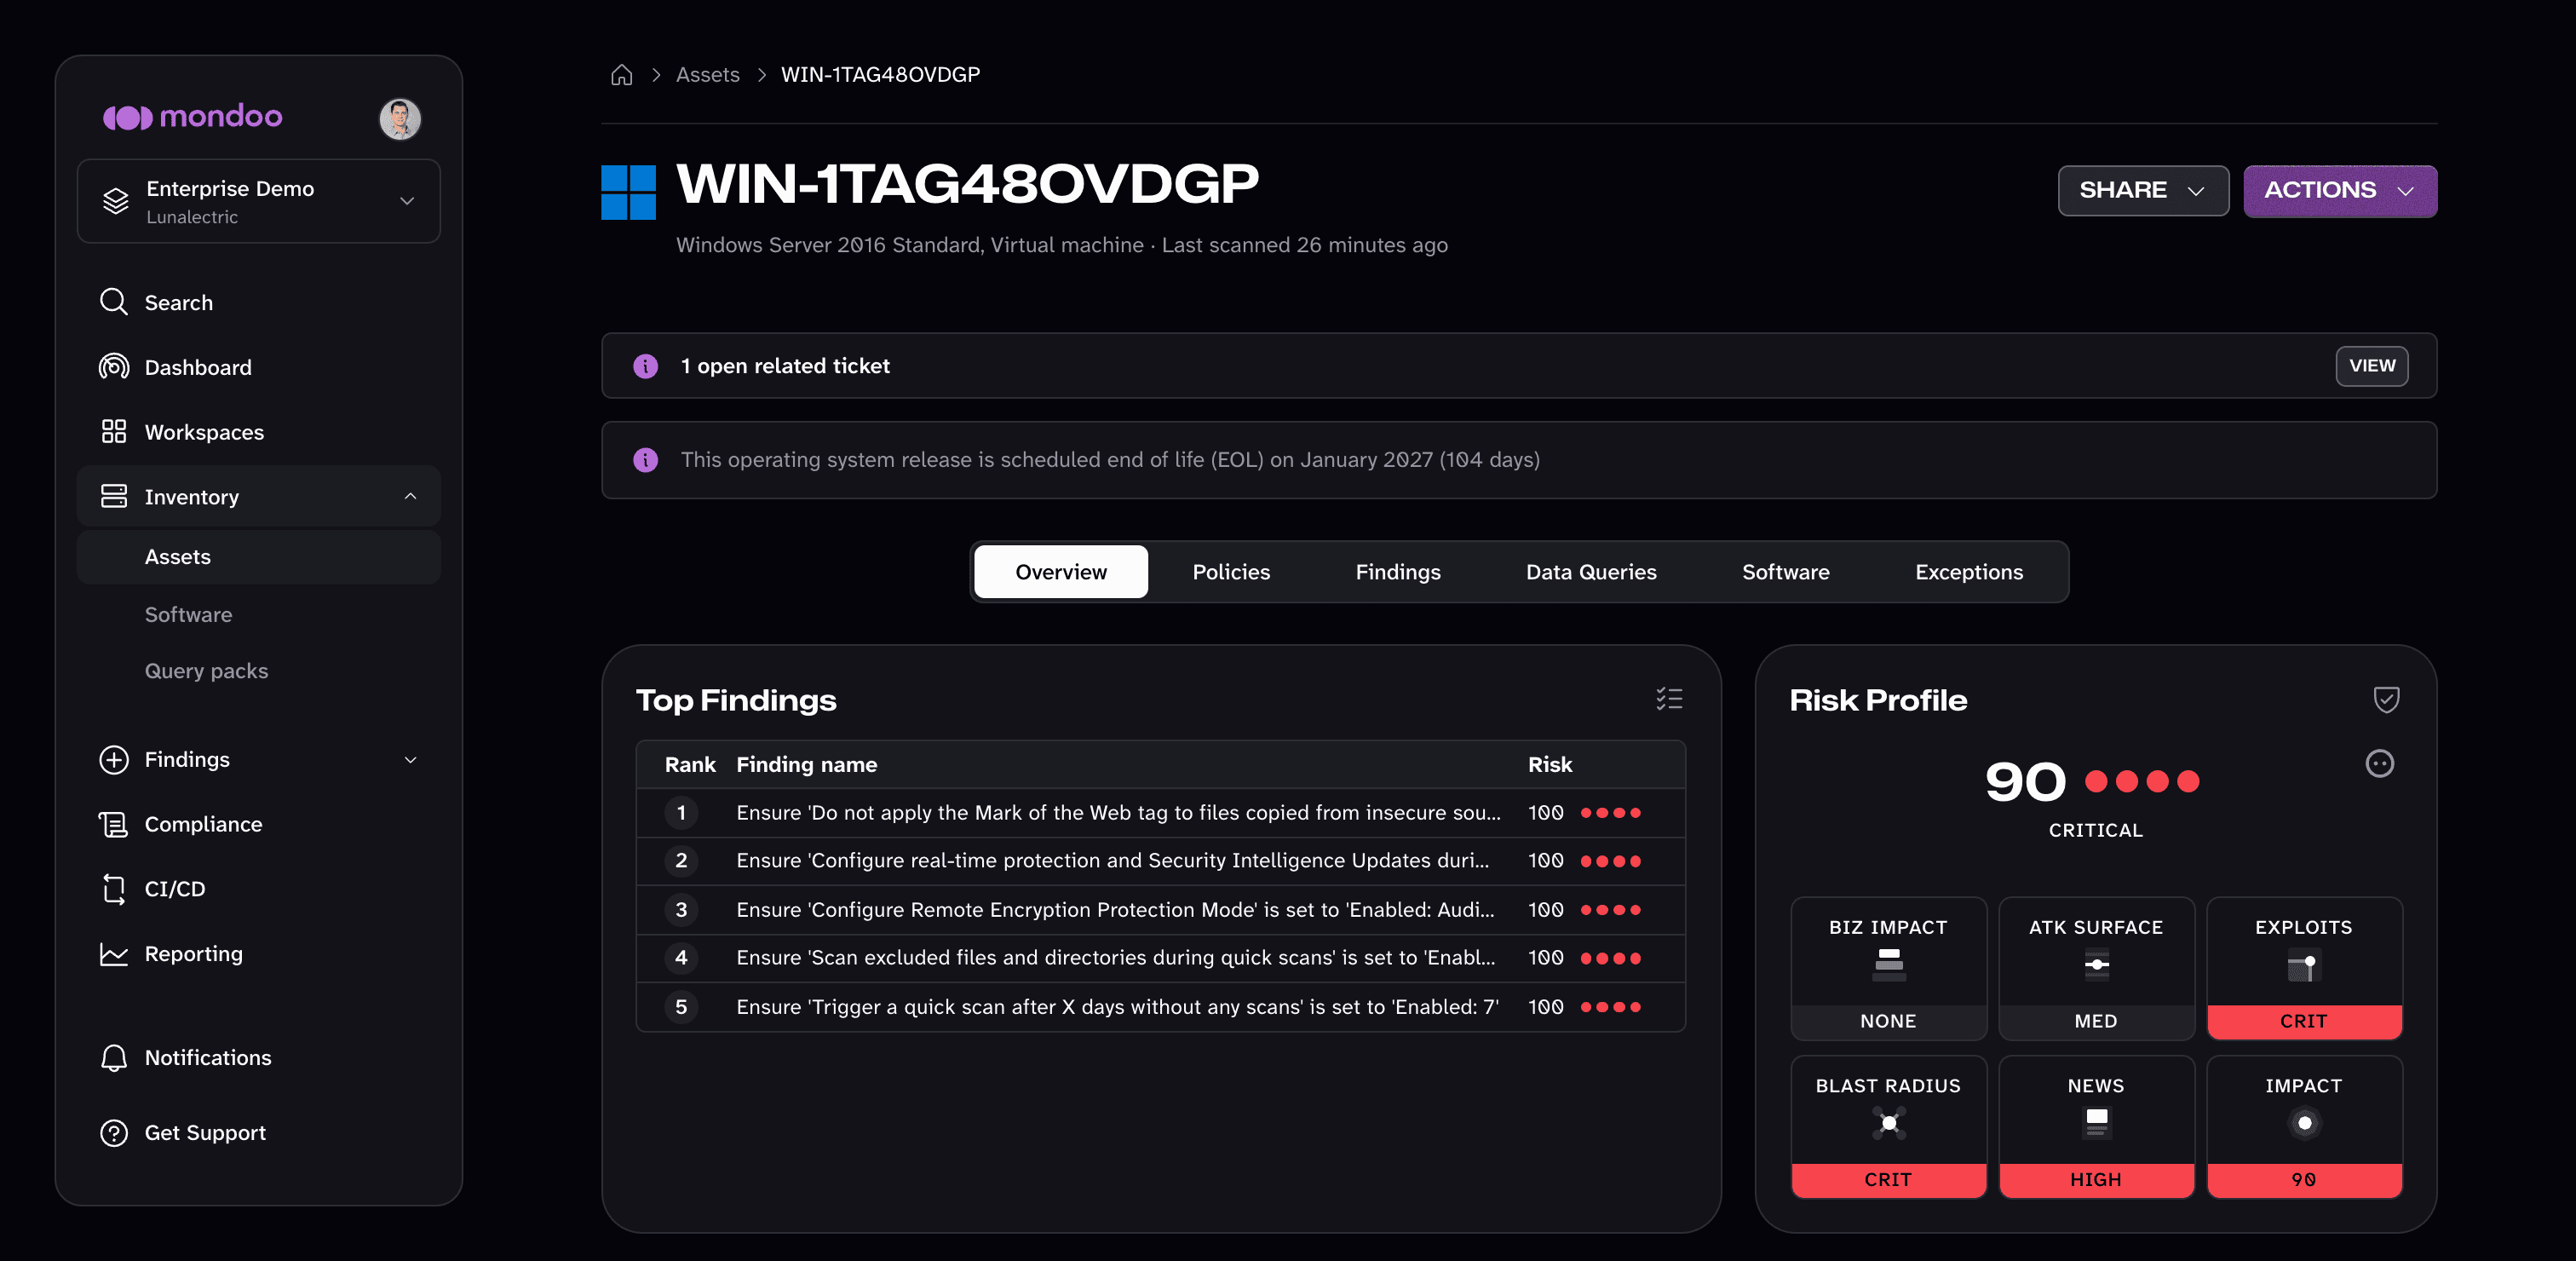
The asset detail page is organized into tabs:
| Tab | Contents |
|---|---|
| Overview | The asset's top findings, its risk profile across the risk categories, and general configuration |
| Policies | The policies applied to the asset and its score on each |
| Findings | Every finding on the asset: failed checks, CVEs, and vendor advisories, with filters for each type |
| Data Queries | Queries that retrieve data on the asset, with results |
| Software | The software packages installed on the asset (shown for assets with an operating system) |
| Exceptions | Exceptions applied to the asset |
To learn how the asset score is calculated, read Asset and Space Risk Scores.