Create an Executive Report
Generate an Executive Report with the four-step wizard and export individual slides to PowerPoint or PNG.
Generate your first Executive Report. For positioning and the slide list, see the Executive Reports overview.
Quick start
If at least one space has scanned assets, you can be done in under five minutes:
- Navigate to your organization, then in the side navigation select Reporting → Executive.
- Step through the four wizard pages: Organization, Spaces, Frameworks, Review & Generate.
- Click Generate Report. When it's ready, the report opens in the viewer.
- Use Print / Save as PDF to export the whole report at once, or use Copy PNG or PPT on an individual slide to drop it into your board deck.
The rest of this page is reference detail for each wizard step plus troubleshooting.
Before you begin
Prerequisites:
- At least one space with scanned assets.
- For per-business-unit views on the Executive Scorecard: assets annotated with a key that identifies each asset's business unit or division.
- For the Controls Assessment slide: at least one compliance framework enabled in the in-scope spaces.
Access Executive Reports
Executive Reports is in the organization-level navigation. If you are currently inside a space, navigate up to your organization first. Reporting → Executive does not appear in the space navigation.
Walk through the wizard
In the side navigation, select Reporting → Executive. The wizard opens at Generate Executive Report and moves through four steps in order.
Step 1: Organization
Describe the organization the board is hearing about. These values shape the Executive Scorecard and the Transformation slide.
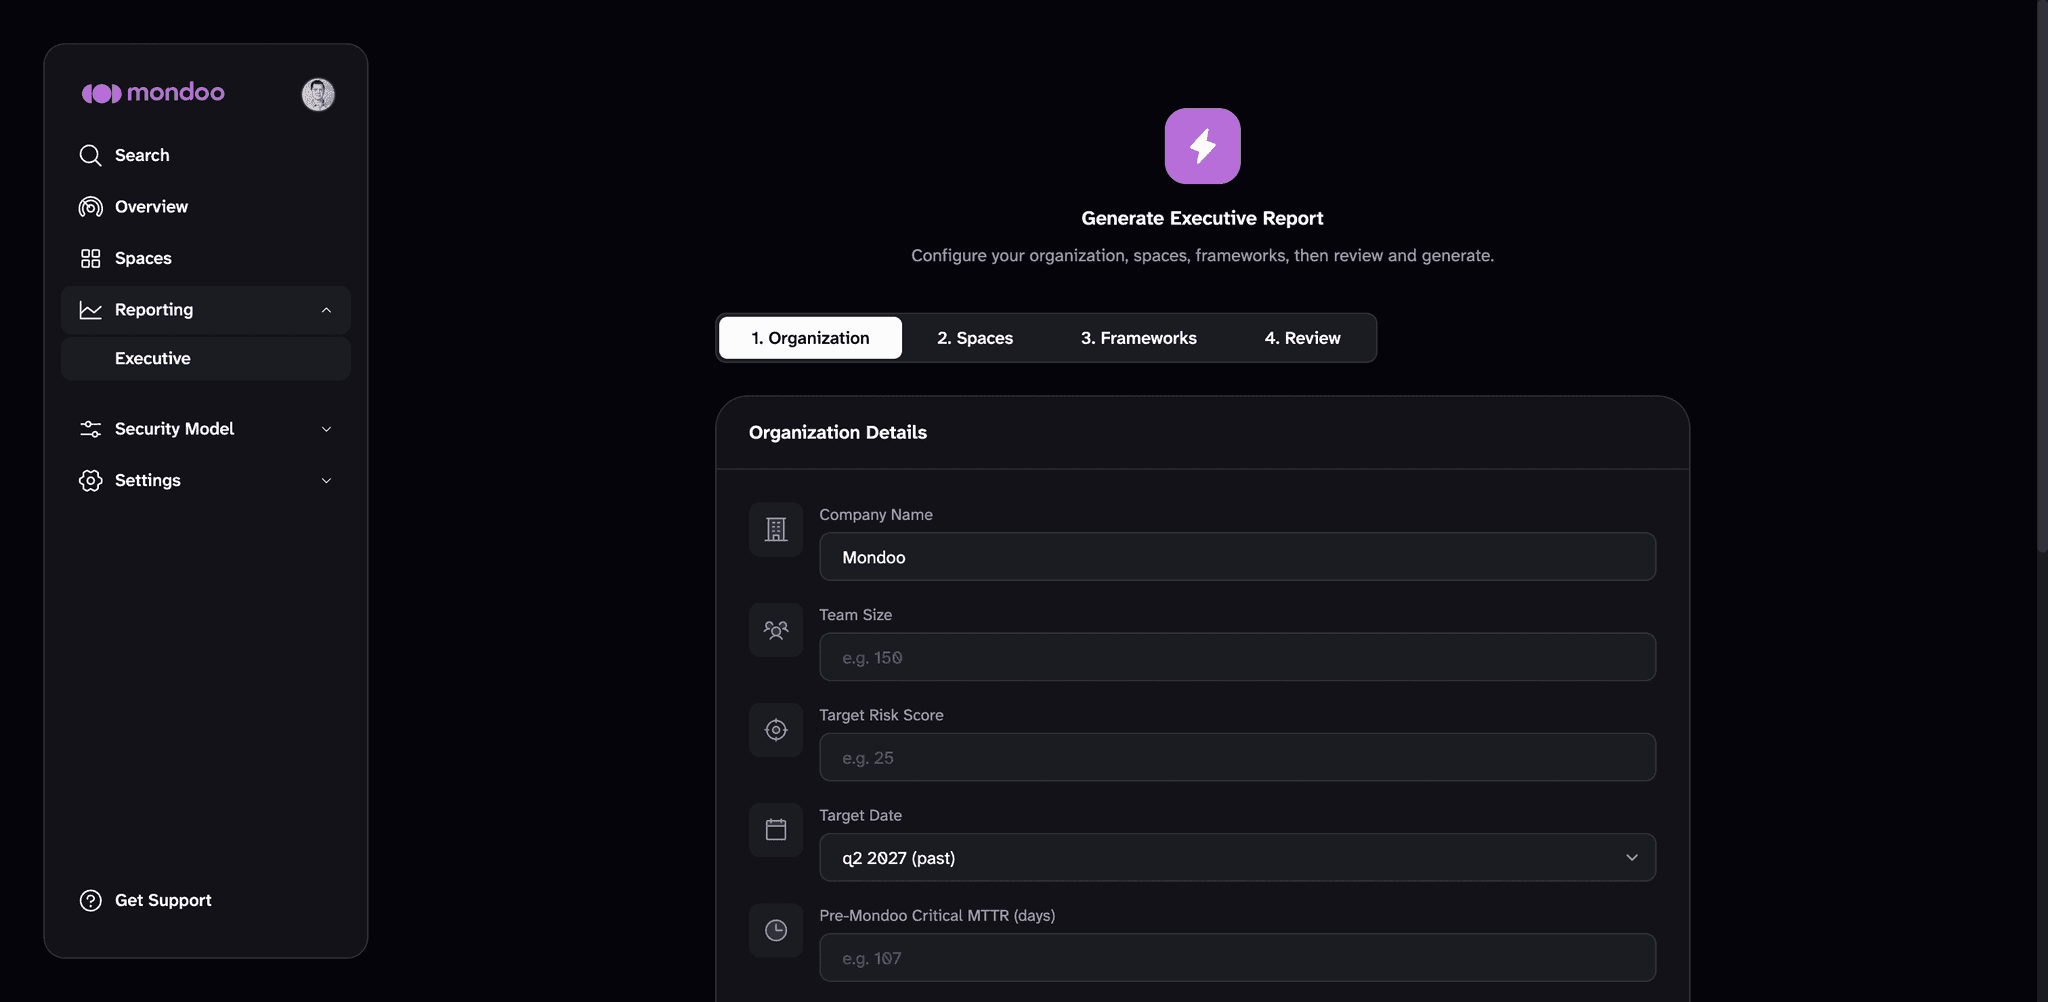
| Field | What it does |
|---|---|
| Company Name | Appears on the title slide and in slide headers. |
| Team Size | Head count of the VM program. Drives per-person throughput and hours saved. |
| Target Risk Score | Board-approved composite risk score target. The Executive Scorecard plots actual against this line. |
| Target Date | The quarter by which you expect to reach the target. Sets the horizon for the trend lines. |
| Pre-Mondoo Critical MTTR (days) | Customer-supplied baseline mean time to remediate critical vulnerabilities, in days, before Mondoo. The Transformation slide uses this as the starting point for the before/after comparison. |
| Pre-Mondoo Maturity Baselines | Optional. Your program's starting maturity (1.0 to 5.0) on each of the five SANS Vulnerability Management Maturity Model dimensions. The Transformation slide uses these as the "before" point for the maturity progression. |
Step 2: Spaces
Choose the spaces the report covers. With Choose spaces, pick spaces by name and the report covers exactly the spaces you select. With By label, the report includes every space that matches the annotation key-value pairs you set. Either way, the report needs at least one space.
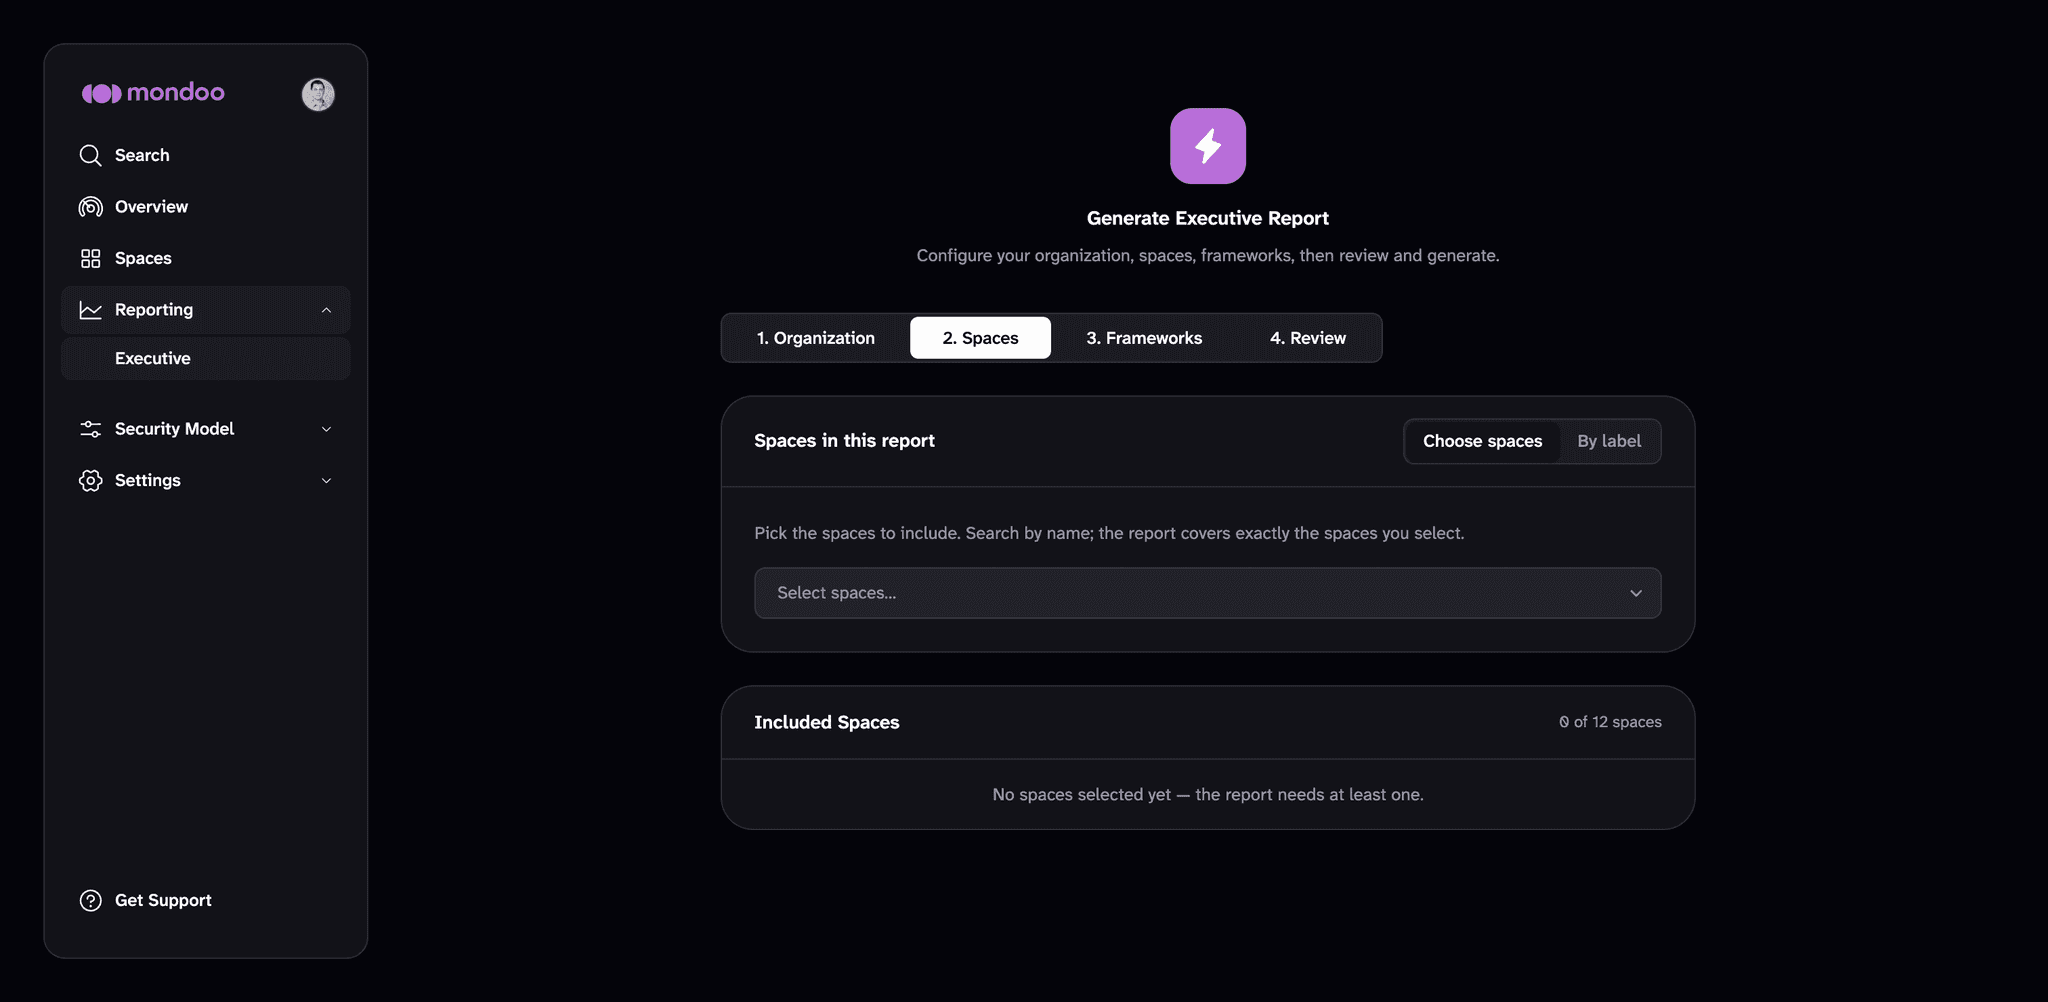
The Included Spaces panel shows the count and names of every space in scope. For a board-level chapter, include every production space. Each space's assets feed the Executive Scorecard and the per-business-unit breakdowns.
Step 3: Frameworks
The frameworks you select here drive the Controls Assessment slide. It shows your organization's maturity against each selected framework. Use SELECT ALL to include every listed framework, or check them individually. For each one you set an Overall goal %, which determines the target line, and a Target by date, which sets the horizon for that framework's target.
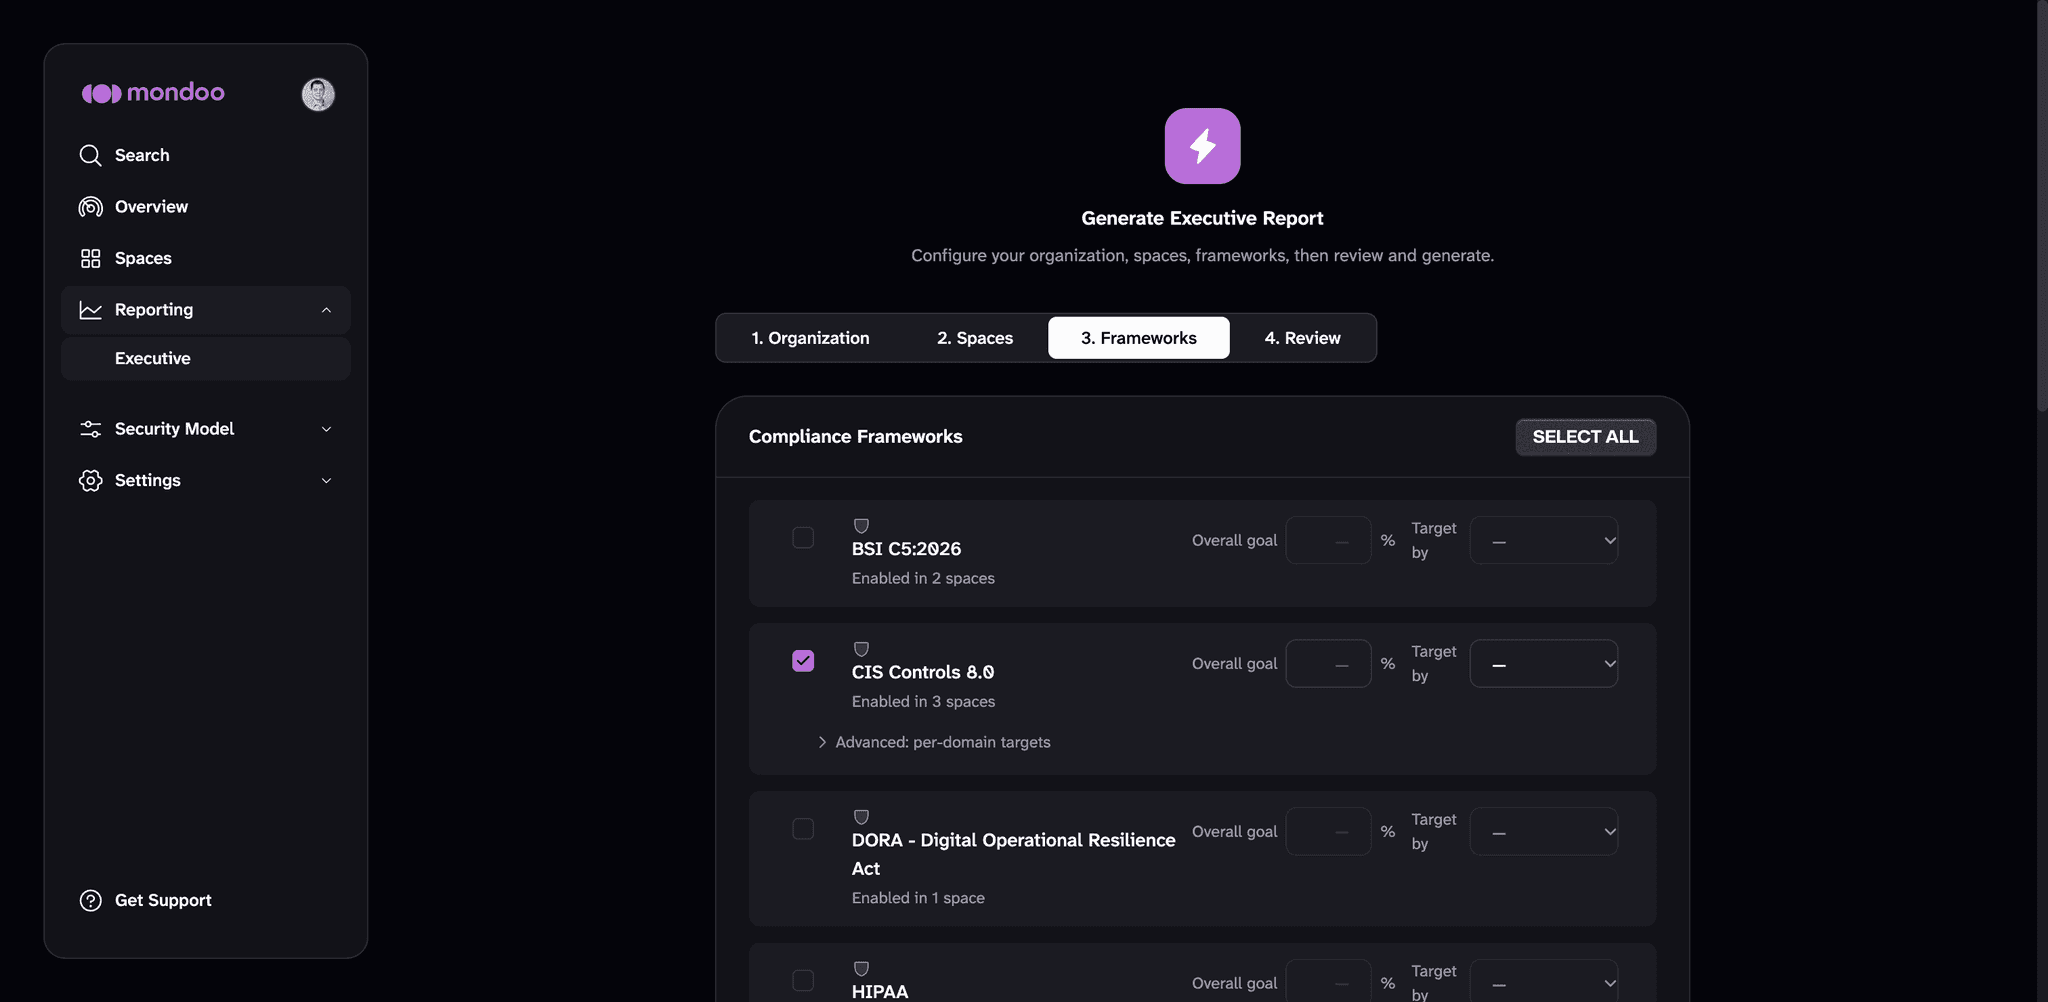
The list shows frameworks already enabled in at least one in-scope space, the count of in-scope spaces where each is enabled, an Overall goal numeric field with a % suffix, and a Target by quarter selector.
Only frameworks enabled in an in-scope space appear here. If the list looks short, enable the frameworks you want covered under the space's Policies page first, then return to the wizard.
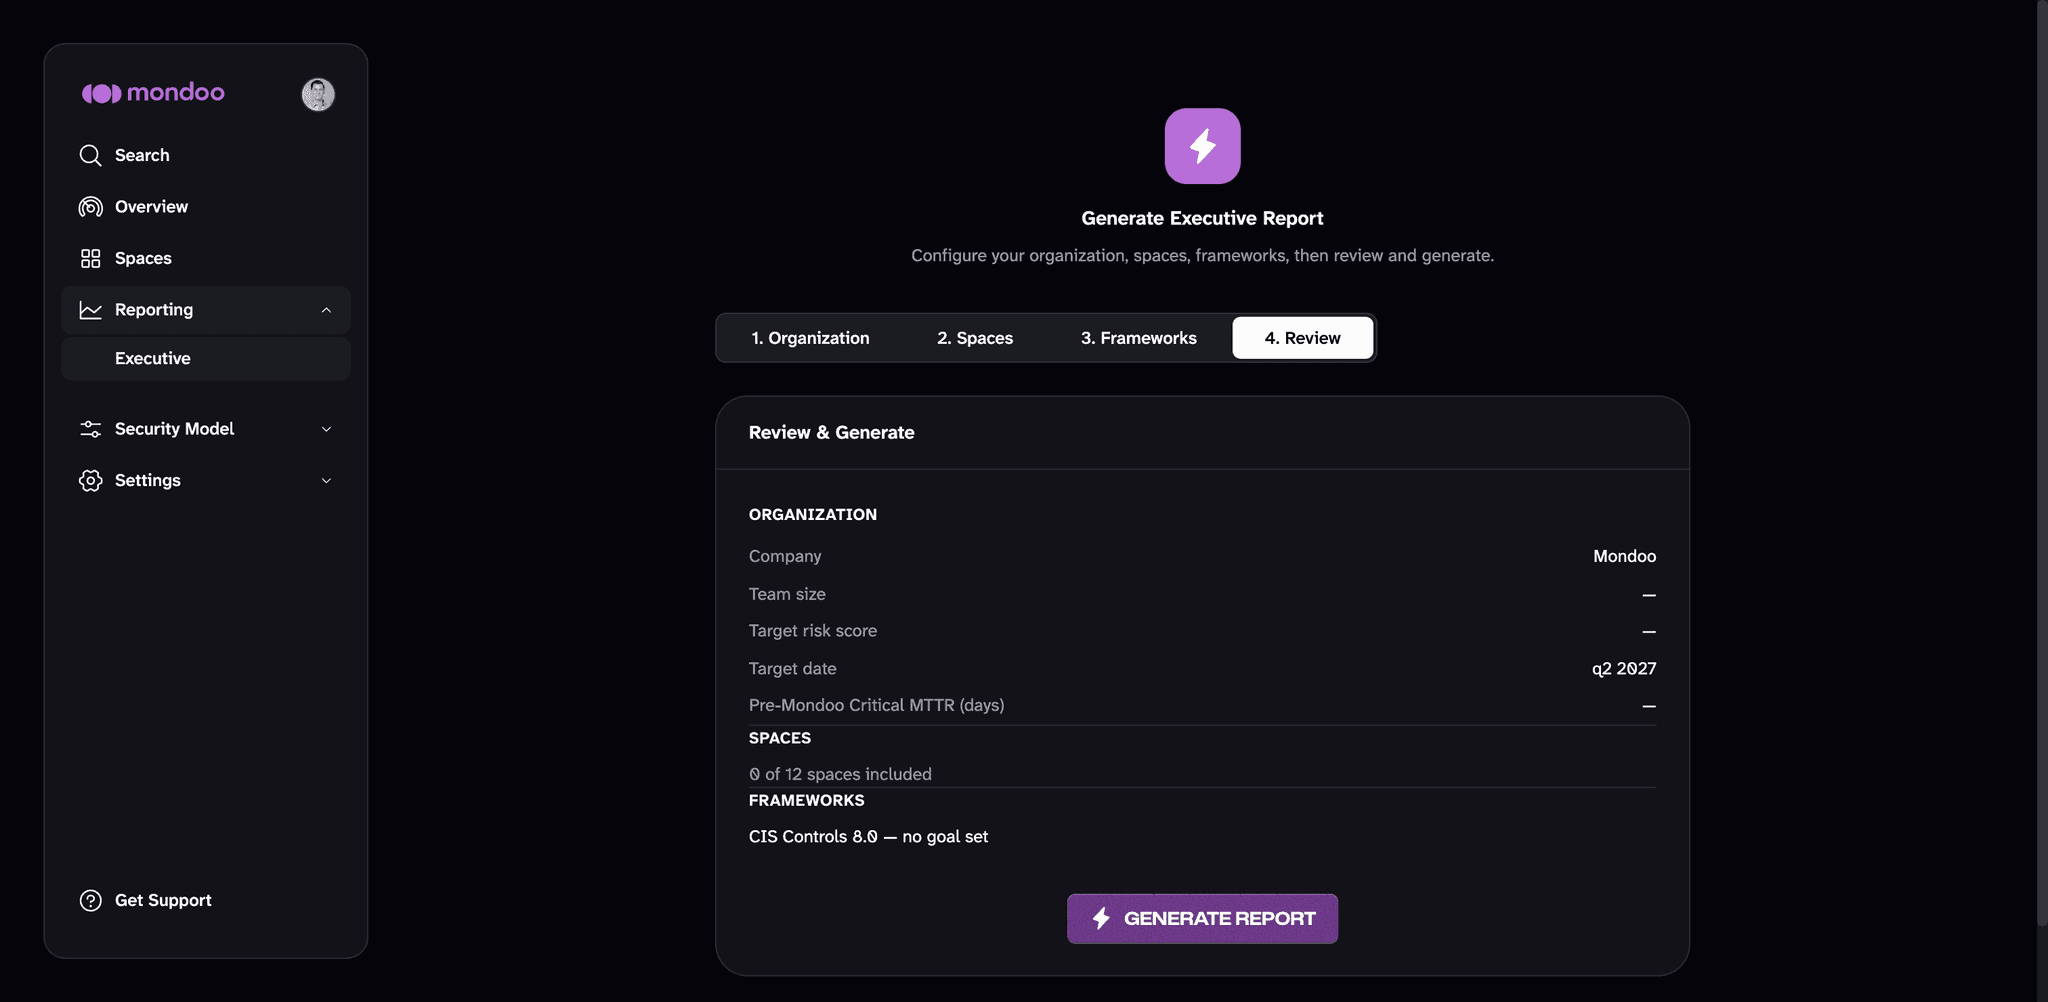
Step 4: Review
Three blocks summarize your selections: ORGANIZATION (the fields from step 1), SPACES (the count and names of included spaces), and FRAMEWORKS (each selected framework with its Overall goal %). Expand Advanced: per-domain targets on any framework to set a different goal per domain (for example, NIS2 Governance at 90% while Supply Chain Security stays at 85%).
When you're ready, click Generate Report. Generation takes a few seconds to a minute. When it's ready, the report opens in the viewer.
Export the report
You can export the whole report at once, or export individual slides.

Whole report:
- Print / Save as PDF. A report-level button (also reachable with Cmd/Ctrl+P) prints or saves the entire report as a single landscape PDF. Use this to hand off the full chapter in one file.
Individual slides:
- Copy PNG. Copy one slide as an image to your clipboard. Paste it into Slack, email, or Notion.
- PPT. Download one slide as a single-slide
.pptx. Embed it in an existing deck or your house board template.
Repeat per slide to assemble a multi-slide chapter.
Troubleshooting
The Reporting nav item doesn't appear. Make sure you are at the organization level, not inside a space. Executive Reports is not in the space navigation. If you're in a space, navigate up to your organization. If the item is still missing after refreshing, confirm that your account has access to the organization.
The Executive Scorecard's per-business-unit view is empty. Assets in scope aren't annotated with a business-unit key. Add annotations to the assets you want reflected, pick a single key name (for example, business-unit, division, or bu), and apply it consistently across every asset.
The Controls Assessment slide shows no maturity. The Controls Assessment slide depends on compliance frameworks being enabled and policies running against assets in the in-scope spaces. Confirm that the spaces have scanned assets, the relevant policies are enabled, and that you selected at least one framework in step 3.
An exported .pptx slide is blank or missing data. Usually the timeframe has no data for that slide. Regenerate with a longer window or a narrower scope so every selected slide has something to render.
FAQ
Is Executive Reports on my plan? Yes. It's included in every Mondoo plan at no add-on cost.
Can I edit a section after it's generated? Not in-product. Sections render from live data. To customize further, export to PowerPoint and edit there.
Can I add my own sections? No. The report currently consists of the four always-on slides plus the Transformation slide. You control which frameworks drive the Controls Assessment slide and which spaces are in scope, not the slide set or the order.
How many slides will my report have? A cover plus four always-on content slides (Cumulative Remediations, Fix Velocity, Controls Assessment, Executive Scorecard), plus the Transformation slide when your Mondoo account team has set up a transformation baseline for your organization.
Does the report pull data from all my spaces at once? By default yes. Use the space filters in step 2 to narrow to a subset (for example, production only).
Is my data sent anywhere external? No. Report generation runs inside Mondoo, and the PNG, PowerPoint, and PDF exports are assembled entirely in your browser on your own machine. The slide content is never sent to an external service to produce the export.
Can I generate historical reports? Yes. Pick the timeframe in the viewer after generation; the report renders against the data Mondoo has collected for that window.
What's next
Questions or feedback? Email support@mondoo.com or open a support case.