Code-risk analytics
See where a codebase's risk actually concentrates — the churn × complexity hotspots worth refactoring first, the functions driving them, and how your scan findings land on top of that picture.
Code-risk analytics
A scan tells you what is wrong right now. xgrep analytics tells you where the
trouble keeps coming from — the files that are both changed constantly and hard
to change safely, which is where defects concentrate and where a refactor buys the
most.
It reads two things you already have: your git history and the complexity of the code itself. No scanning, no network, no configuration.
xgrep analytics .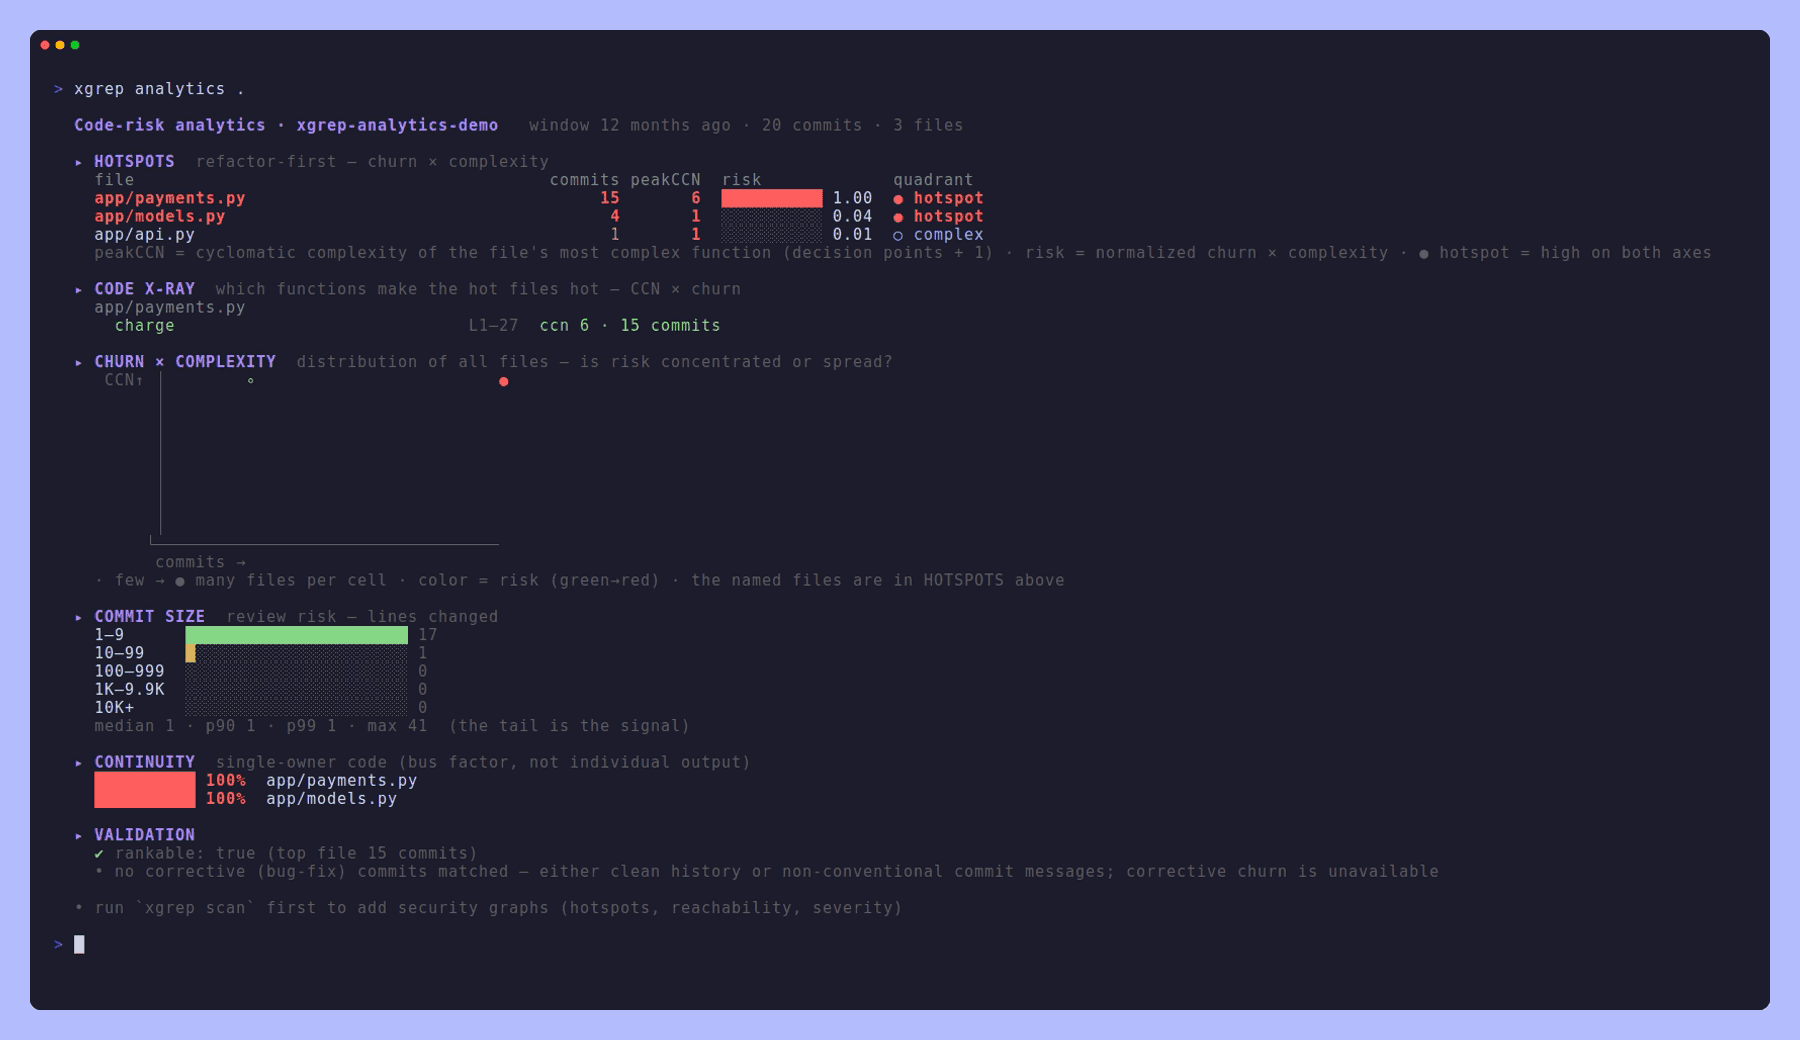
Start here: the hotspot
The first table is the answer to "what should we refactor first?". A file high on
both axes — changed often and structurally complex — is where defects cluster
and where every future change is expensive. Those are marked ● hotspot.
peakCCN is the cyclomatic complexity of the file's most complex function, so a
high number means the complexity is concentrated rather than spread thin.
Code X-ray then takes the hot files apart and names the functions carrying
the churn and the complexity. That is what turns "payments.py is a problem" into a
refactor you can actually schedule: it is charge, 27 lines, complexity 6, touched
in 15 of the last commits.
The rest of the picture
Churn × complexity plots the whole codebase into the plane, so you can see whether risk is concentrated in a few files or smeared across all of them — a different problem with a different fix.
Trend tracks per-file complexity across releases, so you can tell a file that has always been gnarly from one that is getting worse.
Coupling finds files that keep changing together without obviously belonging together. That is usually a hidden dependency, and it is what makes an innocuous change break something across the repo.
Commit size is a log-scaled histogram of lines changed. The median is rarely interesting; the tail is — the giant commits are the ones review did not really catch.
Continuity shows single-owner files. This is bus-factor risk, and it is about coverage and continuity, never individual output.
Validation says whether the ranking is trustworthy for this repository — enough history, no suspect paths dominating — so a thin result reads as thin rather than as a verdict.
Your findings, on the same map
When a previous xgrep scan left its findings cache, analytics crosses the
security picture with the maintenance one — which files carry findings and churn,
how much of the finding set is taint-proven rather than pattern-only, and where the
severity sits.
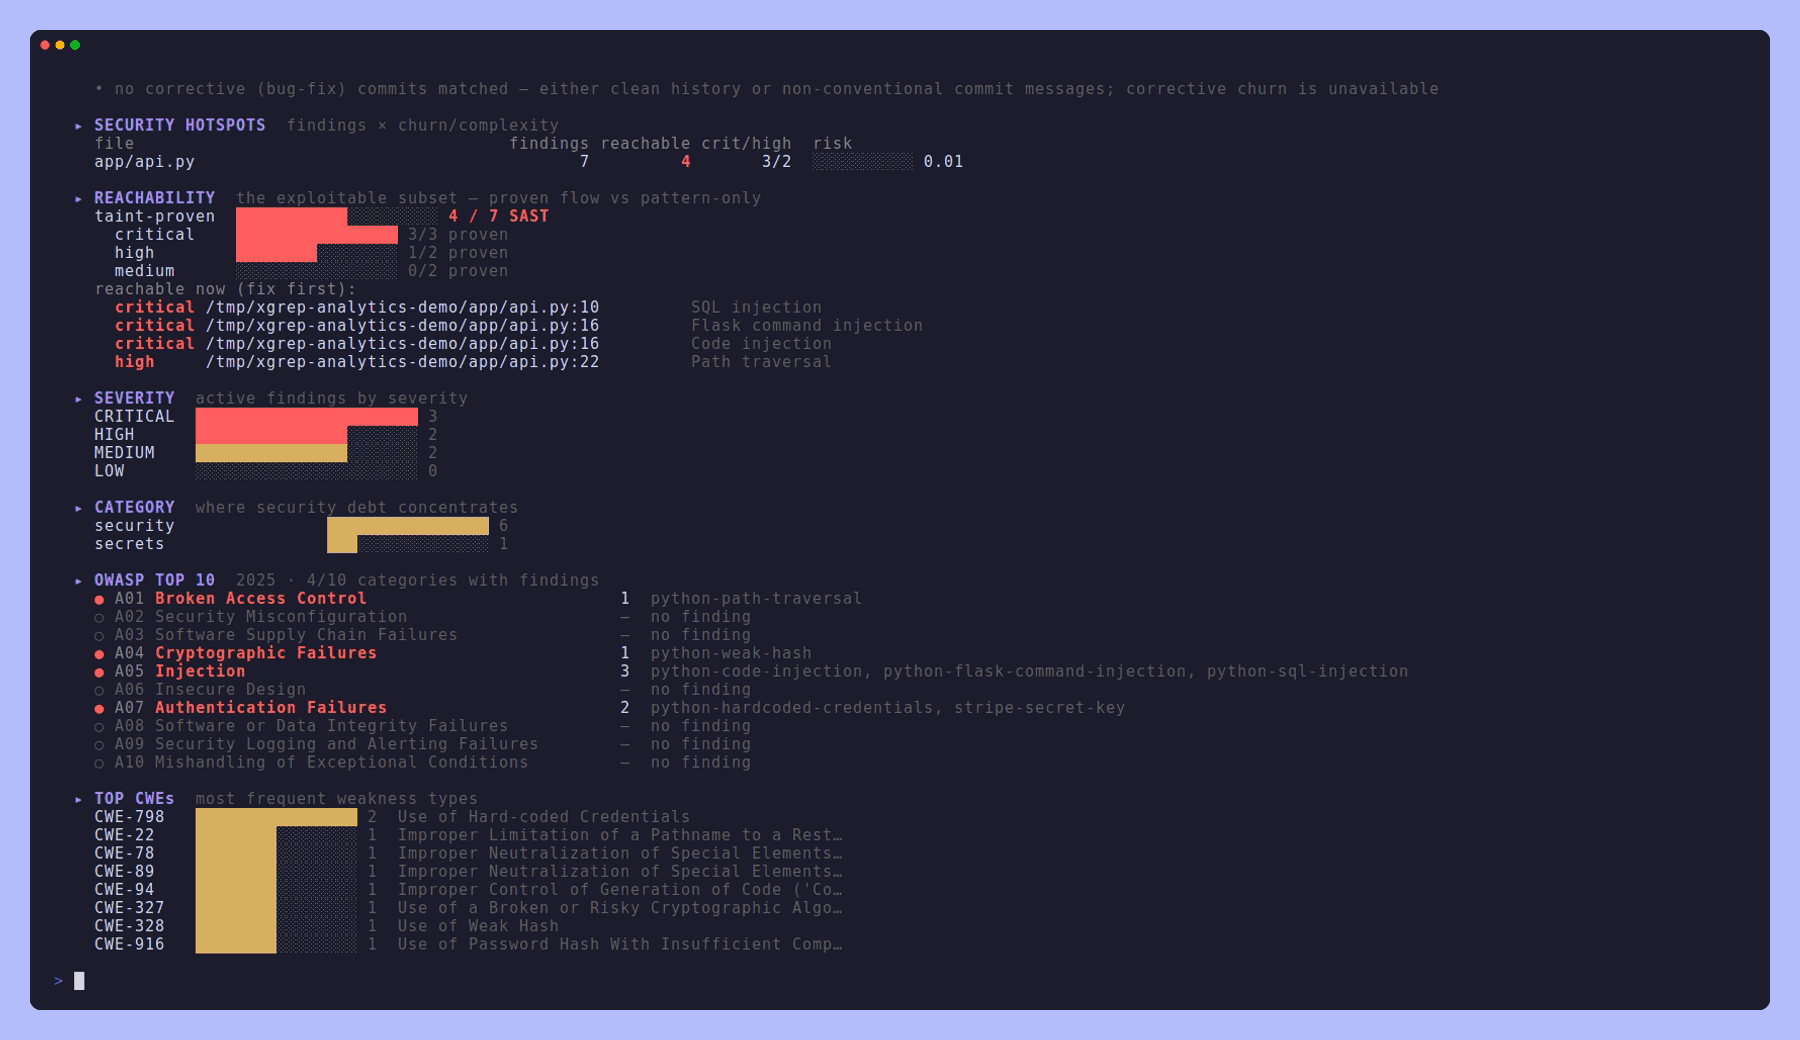
Two classification tables come with it:
- OWASP Top 10 — a coverage scoreboard across all ten categories, marked where
this scan's findings landed.
--owasp-editionpicks the 2021 or 2025 edition (2025 by default). - Top CWEs — the most frequent weakness types by finding count.
Both are also available at the end of an ordinary scan via
xgrep scan --owasp / --cwe,
and in --json under security.owasp / security.cwe.
xgrep scan .        # findings, cached
xgrep analytics .   # the maintenance picture, with those findings on it
Options
| Flag | Effect |
|---|---|
--window <when> | analysis window, e.g. "12 months ago", "6 weeks ago" (default 12 months ago) |
--top <n> | how many hotspots to rank, blame, and trend (default 30) |
--coverage <file> | add an escape-risk axis from a coverage report (Cobertura XML / lcov.info / coverage-final.json) |
--owasp-edition <year> | OWASP Top 10 edition for the coverage scoreboard: 2021 or 2025 (default 2025) |
--json | emit the full report as JSON for further processing |
xgrep analytics is local-only: it prints the dashboard and uploads nothing. To
send the maintenance-risk stream to Mondoo Platform alongside your findings, use
xgrep scan --analytics or xgrep ci --analytics, which report on the same asset
and under the same conditions as the security findings.